Jobs:Housing Ratio in Santa Clara County
Housing Near Jobs Reduces Driving
The jobs:housing imbalance is at the confluence of the climate crisis and the housing crisis.
The simplified version:
- Some area has lots of jobs but not enough housing
- The price of housing in that area goes up
- People move away where the housing is more affordable and commute
- Secondary effects of driving (pollution, greenhouse gasses, collisions, etc) all increase.
The bay area has been in a housing crisis for decades. As the price of housing continues to increase people are commuting from further and further away.
What Makes an Imbalance?
The Jobs:Housing ratio is simple to calculate. (number of jobs in an area) / (number of homes in the same area). This ratio is trying to answer the question: would it be possible for everyone who works in this area to also live in this area?
This is a simplification. It does not take into account household size, housing type, housing preference, retired population, etc. A more complex measure that does take these factors into account is the jobs-housing fit
Since the ratio is inexact, we cannot say with confidence what it ought to be exactly. I will be using the range of 0.75-1.5, as according to the epa this is know to reduce VMT (vehicle miles traveled).
I will use the most recent jobs data from the US Census. This is from 2021. But keep in mind that lots of existing office capacity in the bay area was sitting empty in 2021. So this analysis very likely underestimates the actual housing need.
Why Does the Imbalance Exist?
Very briefly, the proximate cause is Euclidean Zoning and downzoning Euclidean Zoning is an interpretation of zoning that originated in the USA and is characterized by large areas zoned exclusively for very specific uses, which keeps everything separate and creates sprawl. Euclidean Zoning started in the 1920s, and by the 1960 had been adopted by nearly every city in the country.
In the 60s and 70s there was a wave of downzoning, where cities throughout the country further restricted zoning by disallowing higher density housing in many areas where it had been previously allowed. This prevented the normal, gradual densificaiton of cities, and pushed growth out to the edges.
Both these changes were motivated by racism
Analyzing Santa Clara County Cities
Ratio
What is the ratio in Santa Clara County cities? Surprisingly, most municipalities are in balance, when we use the 0.75-1.5 range.
| Area | Homes in 2021 | Jobs in 2021 | Ratio |
|---|---|---|---|
| Palo Alto | 29,039 | 90,610 | 3.12 |
| Cupertino | 21,702 | 52,046 | 2.4 |
| Mountain View | 37,295 | 89,738 | 2.41 |
| Santa Clara | 50,322 | 111,492 | 2.22 |
| Milpitas | 25,184 | 42,806 | 1.7 |
| Sunnyvale | 61,181 | 98,684 | 1.61 |
| Los Gatos | 13,907 | 19,566 | 1.41 |
| Campbell | 18,385 | 24,727 | 1.34 |
| San Jose | 342,065 | 427,369 | 1.25 |
| Morgan Hill | 15,573 | 17,030 | 1.09 |
| Los Altos | 11,786 | 10,815 | 0.92 |
| Gilroy | 18,249 | 16,248 | 0.89 |
| Saratoga | 11,267 | 5,967 | 0.53 |
| Los Altos Hills | 3,102 | 1,639 | 0.53 |
| Monte Sereno | 1,300 | 368 | 0.28 |
| Unincorporated | 27,678 | 49,667 | 1.79 |
By this metric six cities, and unincorporated Santa Clara county, all have a clear housing need. Three cities are imbalanced in the opposite direction. And the county as a whole has a balance of 1.47. Within the tolerance we defined.
Most of unincorporated Santa Clara County is empty. It is Stanford, with over 30,000 jobs, that creates the imbalance. Adding more housing in East San Jose will not fix the imbalance in Stanford. So I will pull out Stanford as if it were it’s own municipality for the rest of the analysis.
According to this chart Los Altos is in balance. But the city is very close to job centers in Mountain View, Palo Alto and Stanford. So building more housing in Los Altos would likely lower VMT for the region as a whole.
Density
Another way to look at it is density, or homes per acre. This might give a better sense of the amount of change needed.
| Area | Acres | Jobs/ac | Housing/ac | Necessary Housing/ac | Increase | |
|---|---|---|---|---|---|---|
| Palo Alto | 16613 | 5.45 | 1.75 | 4.58 | 2.83 | 2.6x |
| Cupertino | 7205 | 7.22 | 3.01 | 5.72 | 2.71 | 1.9x |
| Mountain View | 7810 | 11.49 | 4.78 | 9.1 | 4.32 | 1.9x |
| Santa Clara | 11640 | 9.58 | 4.32 | 7.42 | 3.1 | 1.7x |
| Milpitas | 8670 | 4.94 | 2.9 | 3.48 | 0.58 | 1.2x |
| Sunnyvale | 14649 | 6.74 | 4.18 | 4.65 | 0.47 | 1.1x |
| Stanford | 1832 | 16.56 | 2.61 | 15.25 | 12.64 | 5.8x |
So while Mountain View and Cupertio have similar ratios, Mountain View’s housing need is much higher. And while both Sunnyvale and Mountain View need to build around 30,000 homes to get the ratio below 1.5, it is a much larger change in density in Mountain View. This is because Sunnyvale already has much more housing than Mountain View.
Regional Housing Needs Assessment
The California HCD (Housing and Community Development) department tries to force cities to build housing. The process is called RHNA (Regional Housing Needs Assessment). The process is indirect and has so far been ineffective. But recent legislative changes have made it more difficult for municipalities to ignore state law.
RHNA assigns each municipality an allotment of housing that should be built. But the assessment is not focused on the jobs:housing ratio.
| Area | Ratio | Housing Needed for 1.5 Ratio | HCD RHNA |
|---|---|---|---|
| Palo Alto | 3.12 | 47,051 | 6,086 |
| Cupertino | 2.4 | 19,493 | 4,588 |
| Mountain View | 2.41 | 33,795 | 11,135 |
| Santa Clara | 2.22 | 36,009 | 11,632 |
| Milpitas | 1.7 | 5,030 | 6,713 |
| Sunnyvale | 1.61 | 6,912 | 11,966 |
| Unincorperated | 1.79 | 8,150 | 3,125 |
| Stanford | 6.35 | 23,173 | N/A |
Clearly RNHA has other goals.
Another reason RHNA cannot address the jobs:housing imbalance is that it does not restrict cities adding jobs. Plans like North Bayshore in Mountain View or Moffett Park in Sunnyvale are a big part of how these cities plan to meet their housing goals. But those projects also add new office. So even if they are built the imbalance will remain.
A Regional Map of the Imbalance
HCD and state law operates at the municipal level out of necessity. But a map which only shows the municipal stats would not be of much use. San Jose is “in balance” in the same way the county as a whole is “in balance”.
San Jose is not in balance, because the city is spread out over a huge area, but most of the jobs are concentrated in the center. So just like Mountain View and Palo Alto need to build housing near their job centers, so San Jose should build housing near downtown.
So I will do a similar analysis as above, but without considering municipal boundaries. A more granular approach is needed.
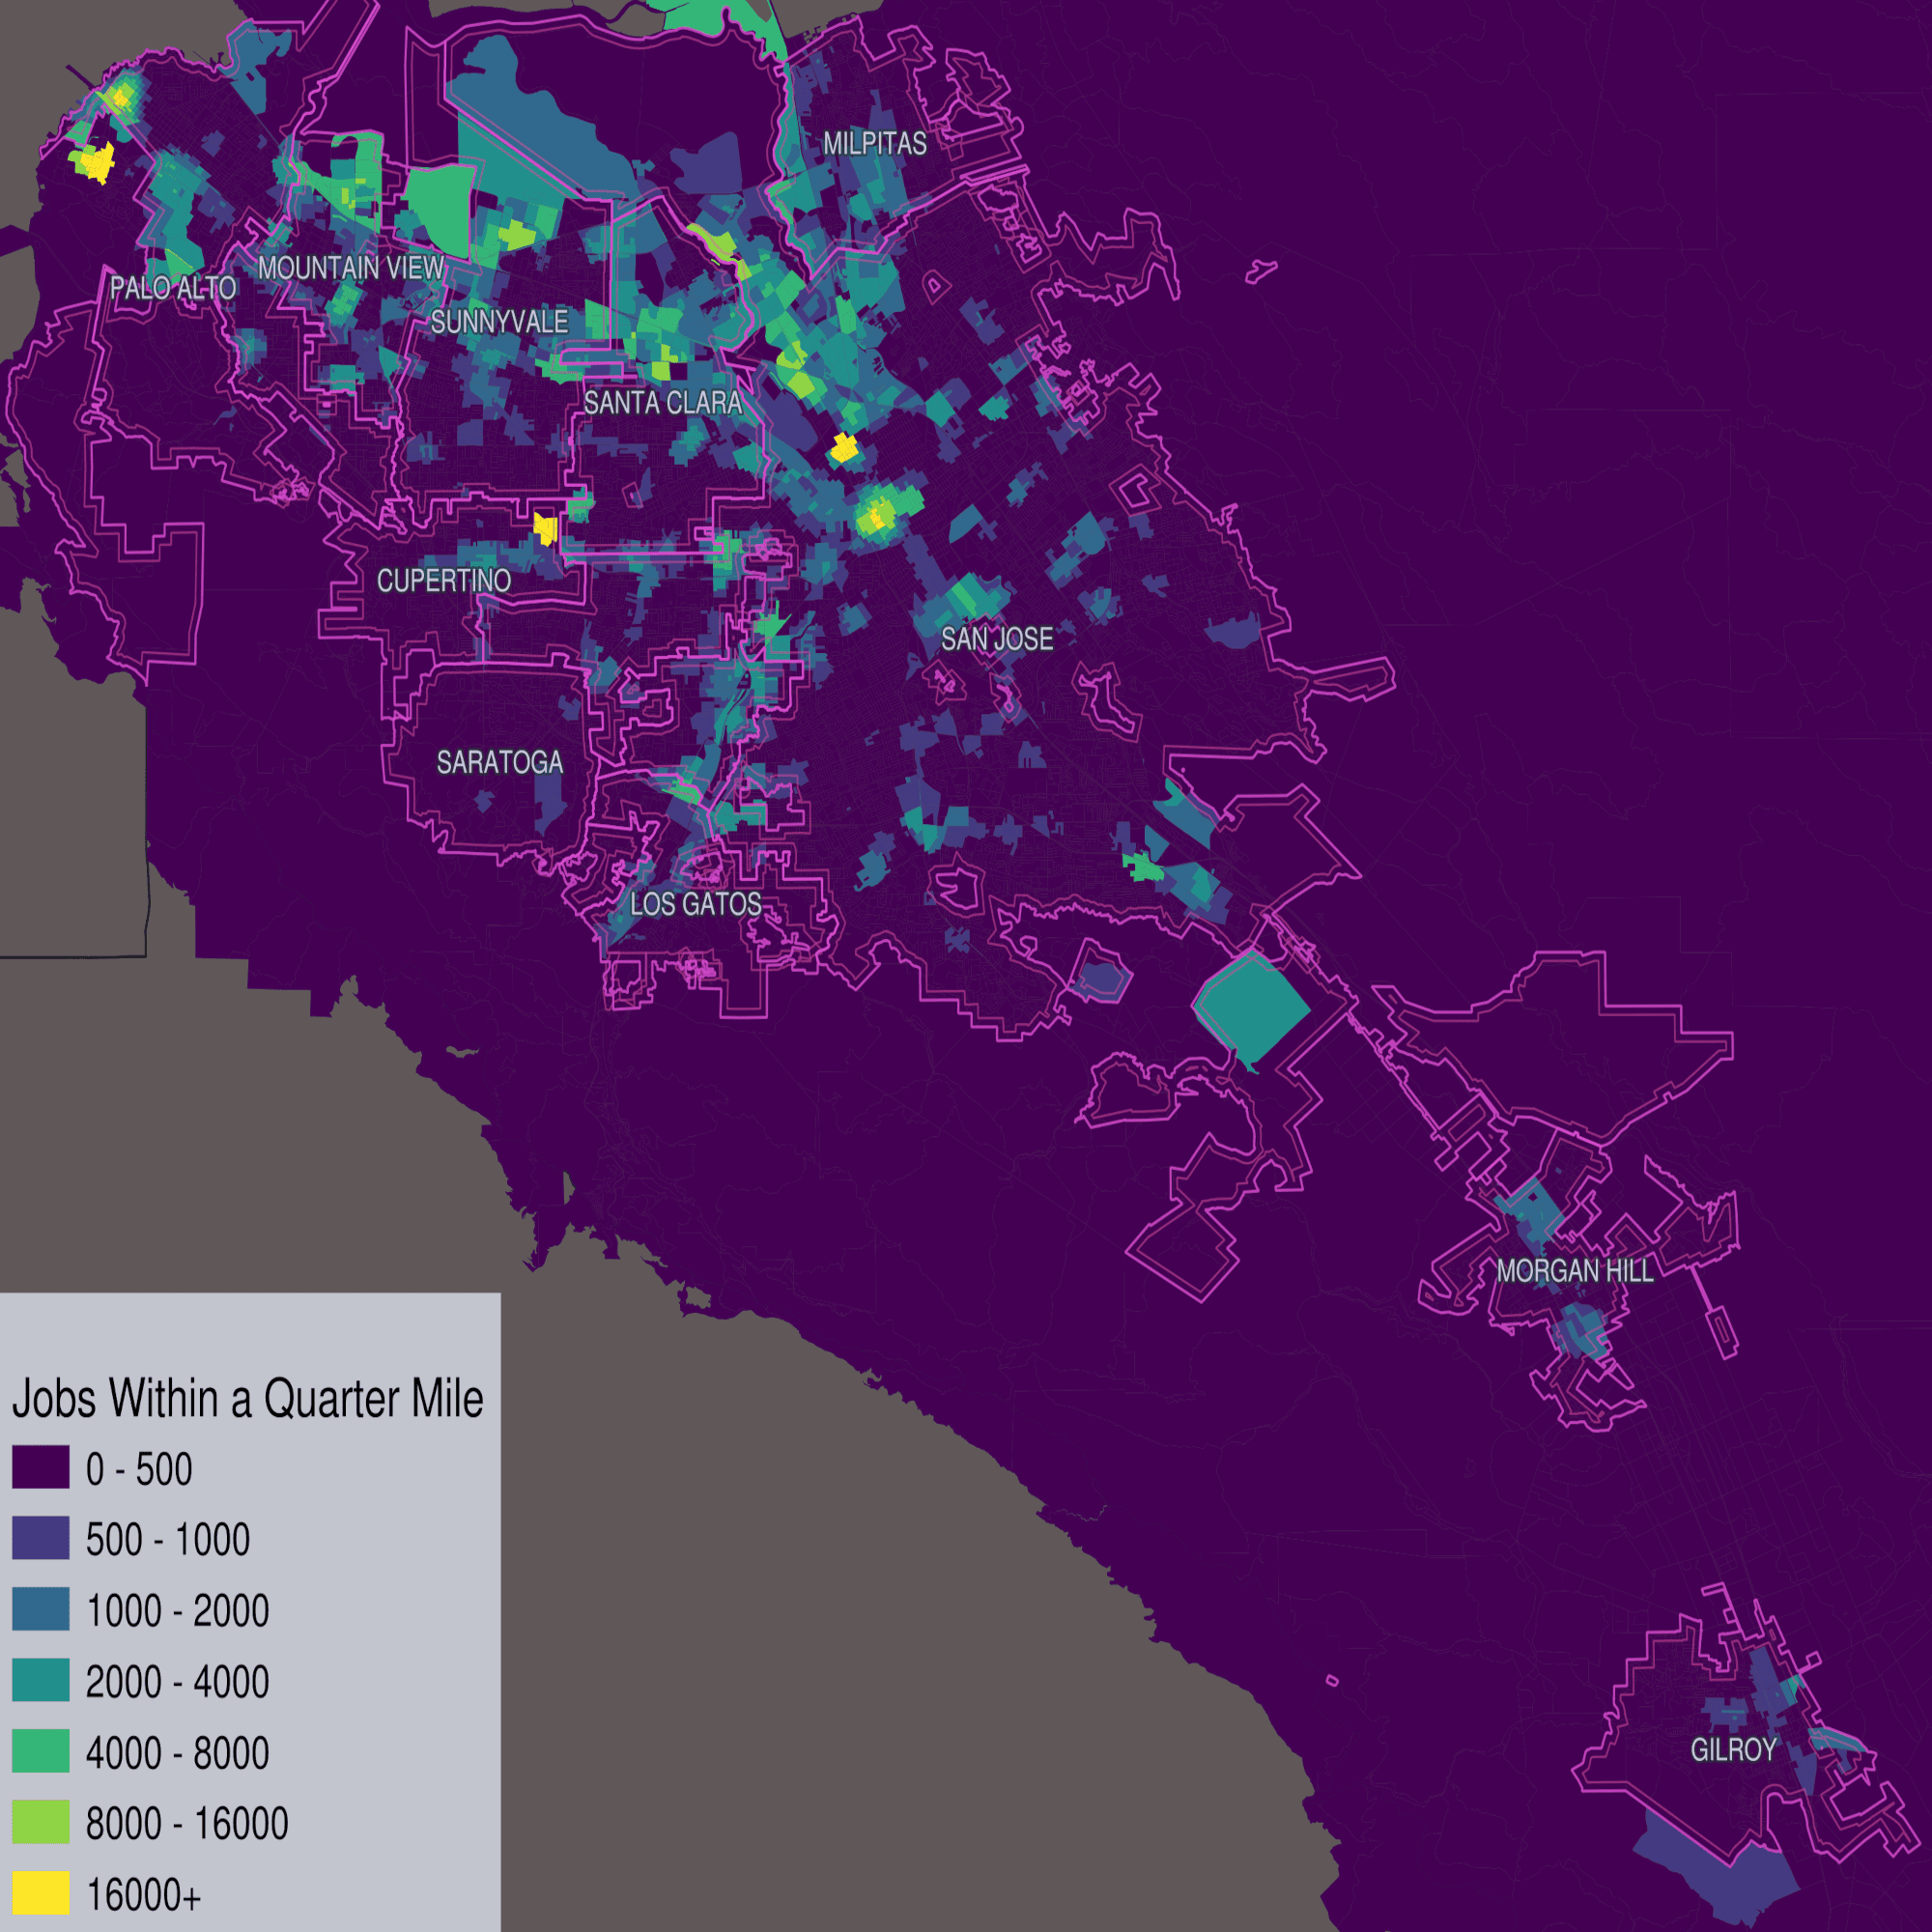
I have been using data from the US Census LEHD Origin-Destination Employment Statistics. 2021 is the most recent data. The data on employee count has a granularity of census block, which can be pretty small.
We can take the centroid of each block, and sum the number of homes and jobs within a certain radius of the center. For large blocks (mostly rural) this will only include the block itself, but for smaller blocks (mostly urban) we can get a pretty good average of the area.

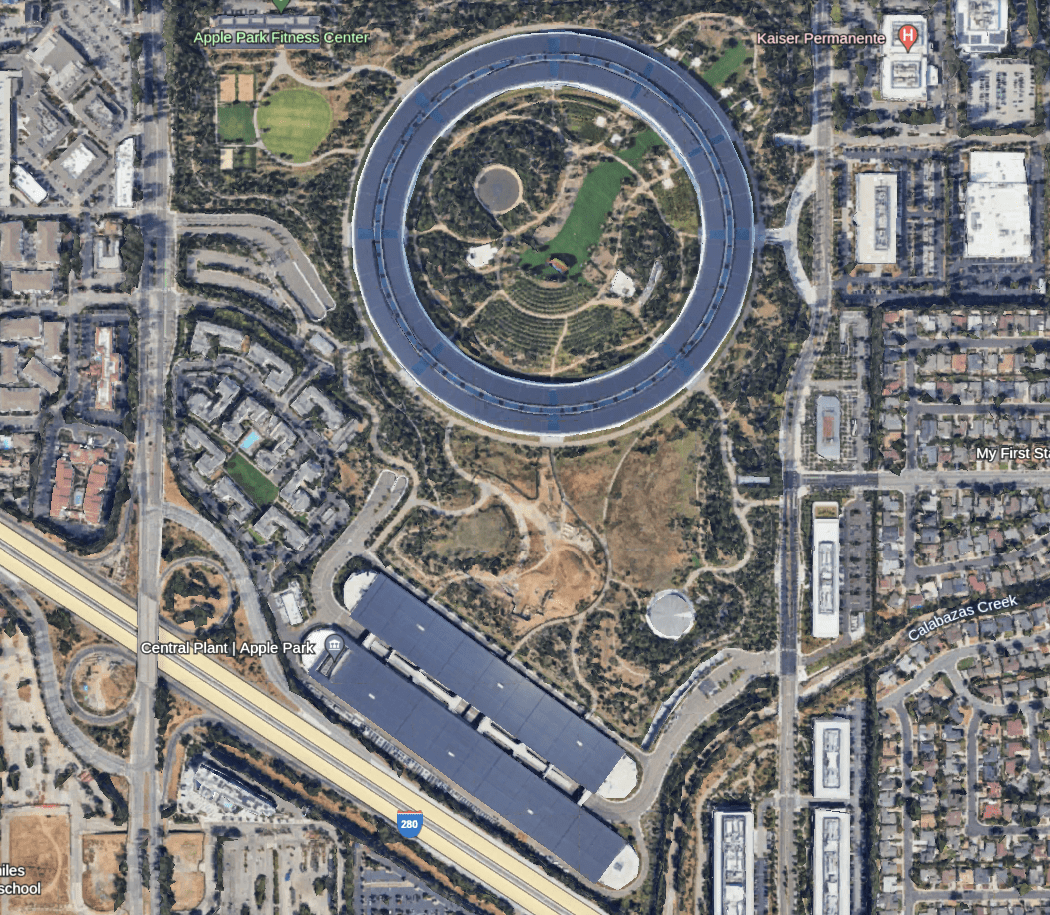
Incidentally the largest spike is because of this one block.

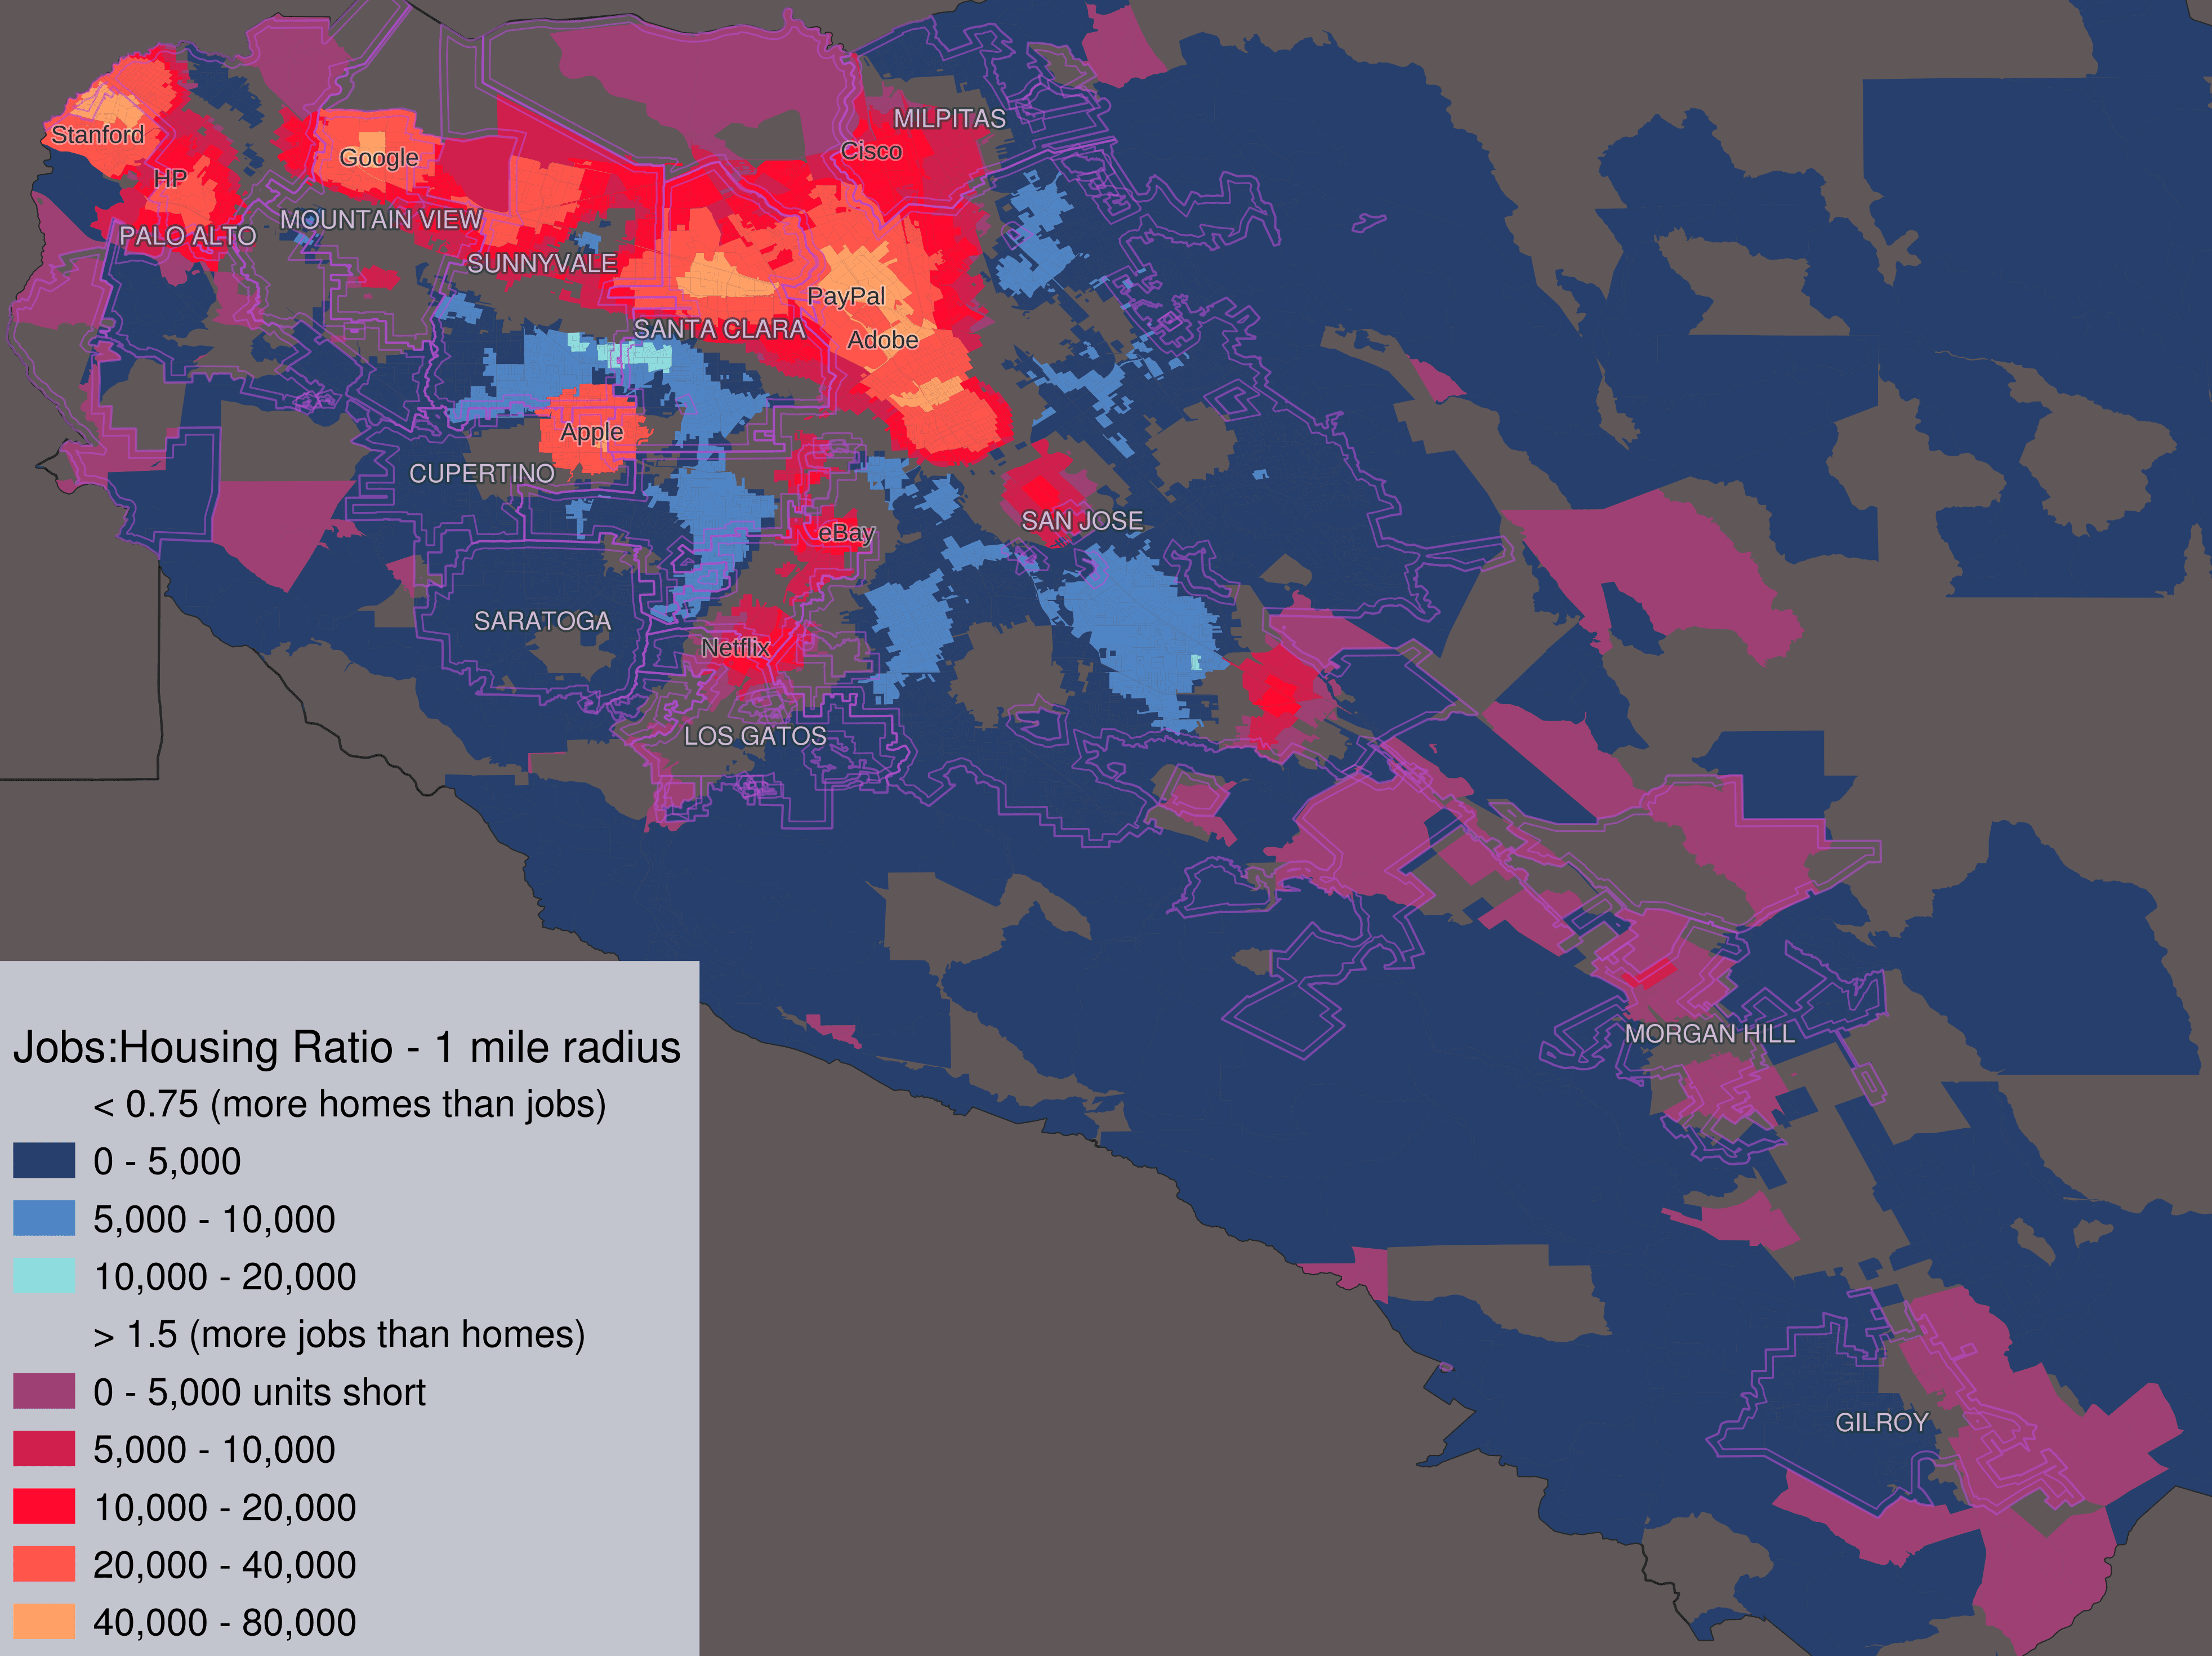
To understand the imbalance, I decided to use a 1 mile radius. For each census block I calculated the jobs:housing ratio for the circle with 1 mile radius centered on the center of the block.
The resulting map shows clearly where the imbalances are.

The imbalance is concentrated in north county. But even Morgan Hill and Gilroy have areas were housing is needed.
There is no area with a spike in housing supply that comes close to the spike in jobs. Several areas would need over 80,000 homes to bring into balance.
Conclusion
The built environment in Santa Clara County guarantees large number of commuters. It is not possible for everyone to live close to work, because the necessary housing does not exist. The existing process is not sufficient to build this housing.
To reduce commuting, over 100,000 housing units are needed. The existing housing element and RHNA framework will not build these units. Something different is needed.