Zones and Density in Mountain View
Which zones cover the most area in mountain view? Which have the most homes?
I have been listening in to some of the housing element talks.
My understaning is that Moutain View has been assesed by the state as needing to build an additional 11,000 homes in the next eight years.
Thinking about where should those homes be built made me wonder where homes currently exist in Moutain View, and what the zoning rules currently allow.
1. Zones
Mountain view has 15 zoning categories
Categories starting with R are residential, ones starting with C are commercial, and ones starting with M are manufacturing.
 |
|---|
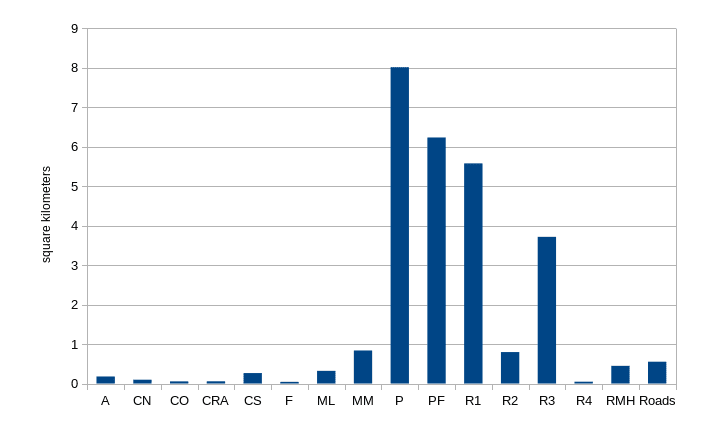
| Area Of Mountain View By Zone Category |
Like most cities in the USA, R1 (single family housing) is the largest residential zone.
But R3 (multifamily) is also covering a very large area, indicating that Mountain View is more dense and less suburban than most people think.
PF is “Public Facility”, such as parks and etc. The bulk of the PF area is Shoreline Park/Baylands in the north.
P means “Precise Plan”, and is the largest zone class by area. “Precise Plan” means that there is a plan that does not fit in the other zone categories.
It complicates our analysis. I will go into more detail about precise plans below.
 |
|---|
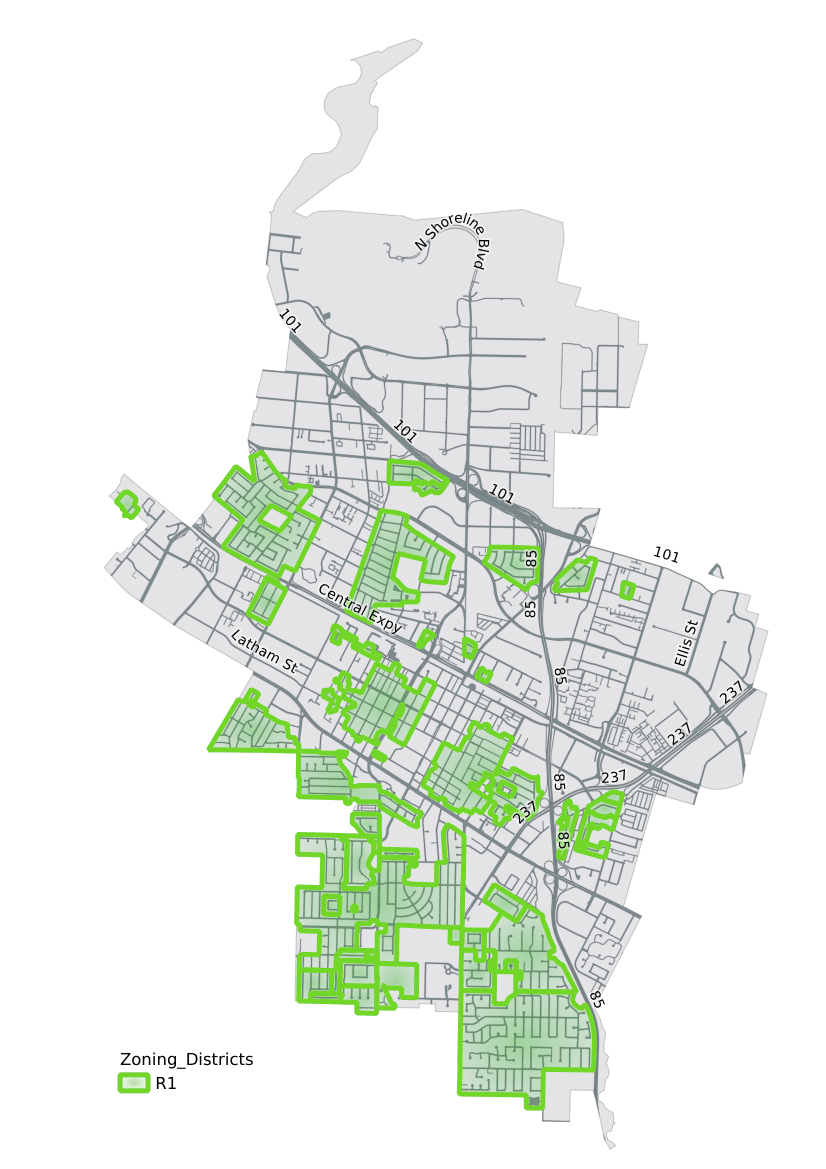
| Area Of Mountain View Zoned R1 |
R1 is single family homes. This zone class dominates Mountain View south of El Camino Real. 20% of mountain view is zoned R1, and over 7500 homes are in R1 zones.
For more details, the city has an R1 Zoning Handbook
 |
|---|
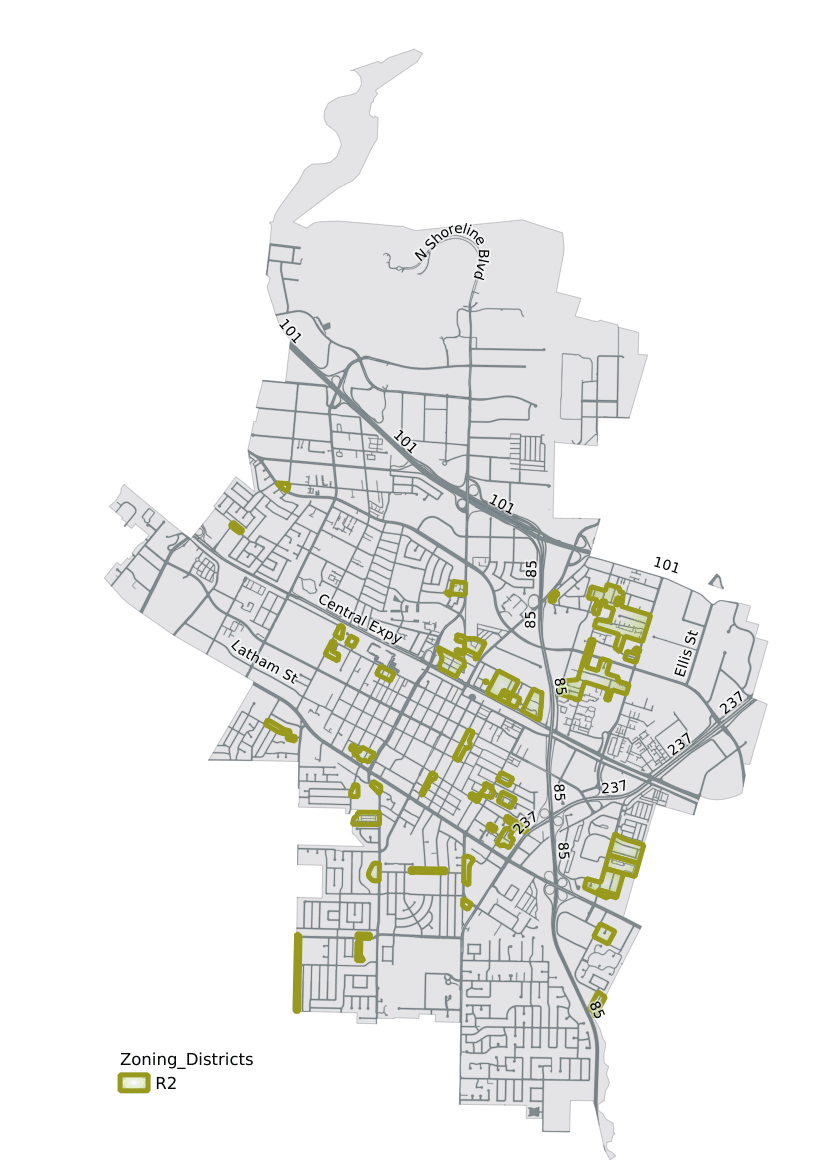
| Area Of Mountain View Zoned R2 |
R2 is essentially the same as R1, except it allows duplexes. R2 only accounts for around 3% of the land area of Mountain View, and over 1500 homes.
 |
|---|
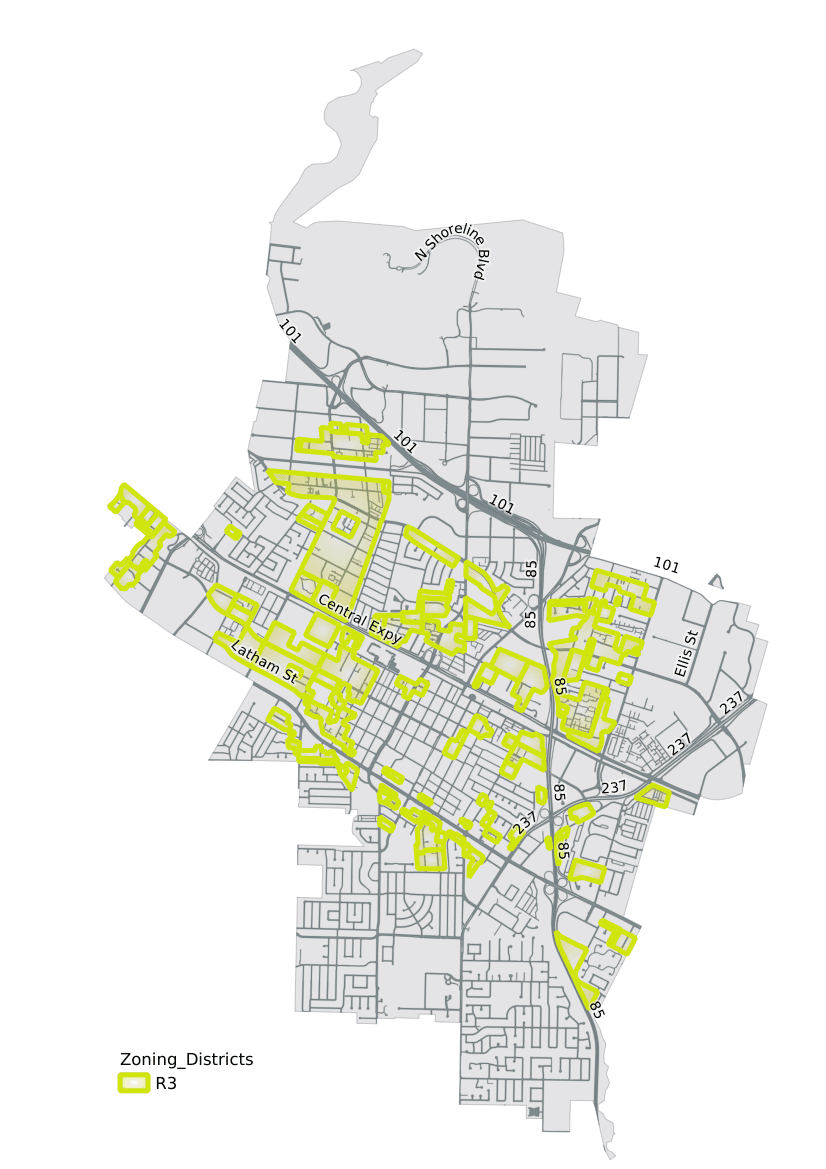
| Area Of Mountain View Zoned R3 |
R3 is multifamily zoning. This includes apartments, condos, and increasingly rowhouses.
R3 has less area than R1, at about 14%, but it has more than double the number of residences - over 15000.
R3 is also being upzoned this year, and seems to be the primary focus in talks of adding more homes to Mountain View.
 |
|---|
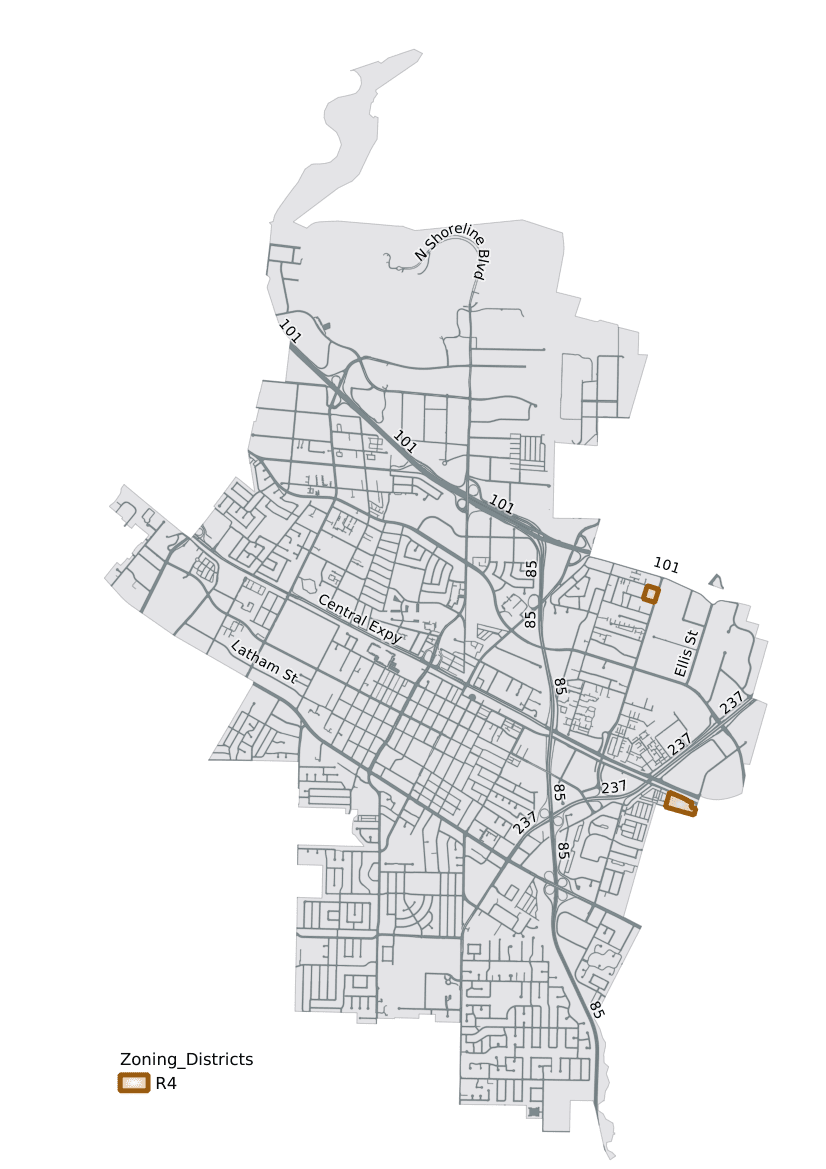
| Area Of Mountain View Zoned R4 |
R4 is “high density zoning”. However, at 0.2% of area and less than 200 homes it does not affect density much.
 |
|---|
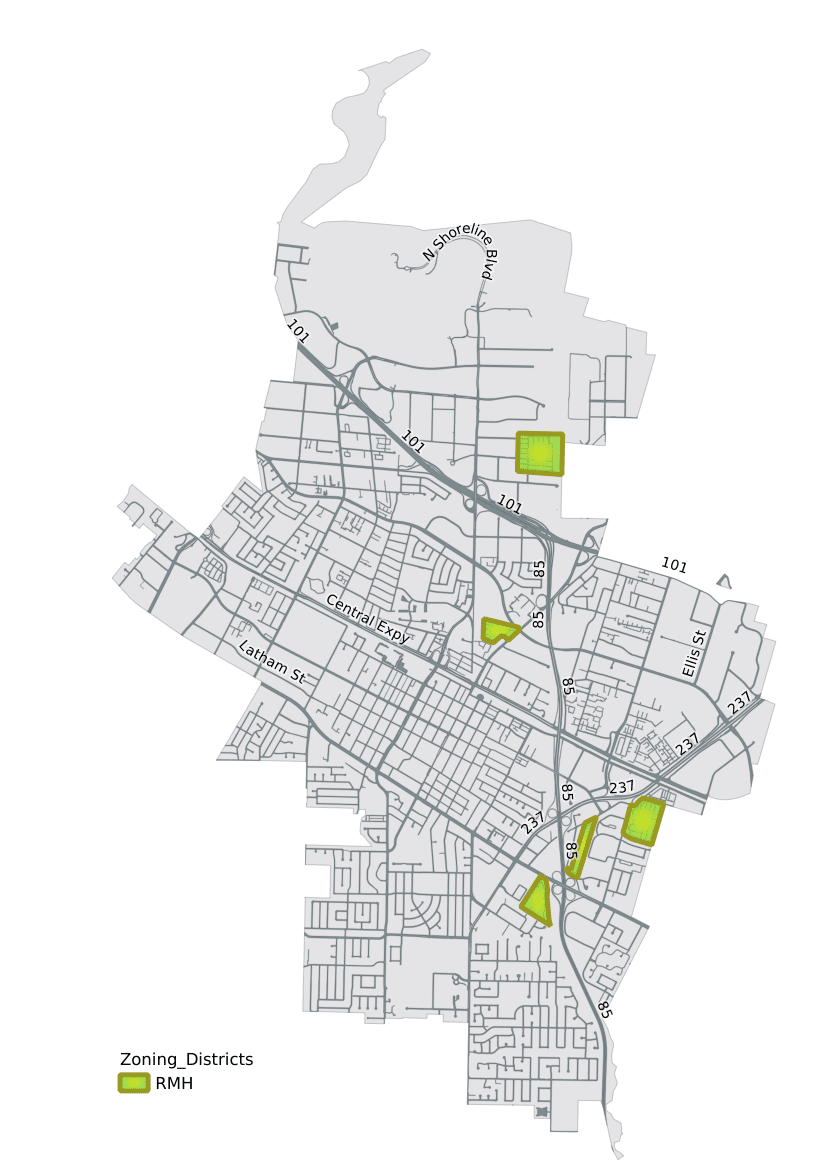
| Area Of Mountain View Zoned RMH |
RMH is mobile homes. Mountain View has 5 mobile home parks, making about 1.5% of it’s area and over 1000 homes.
 |
|---|
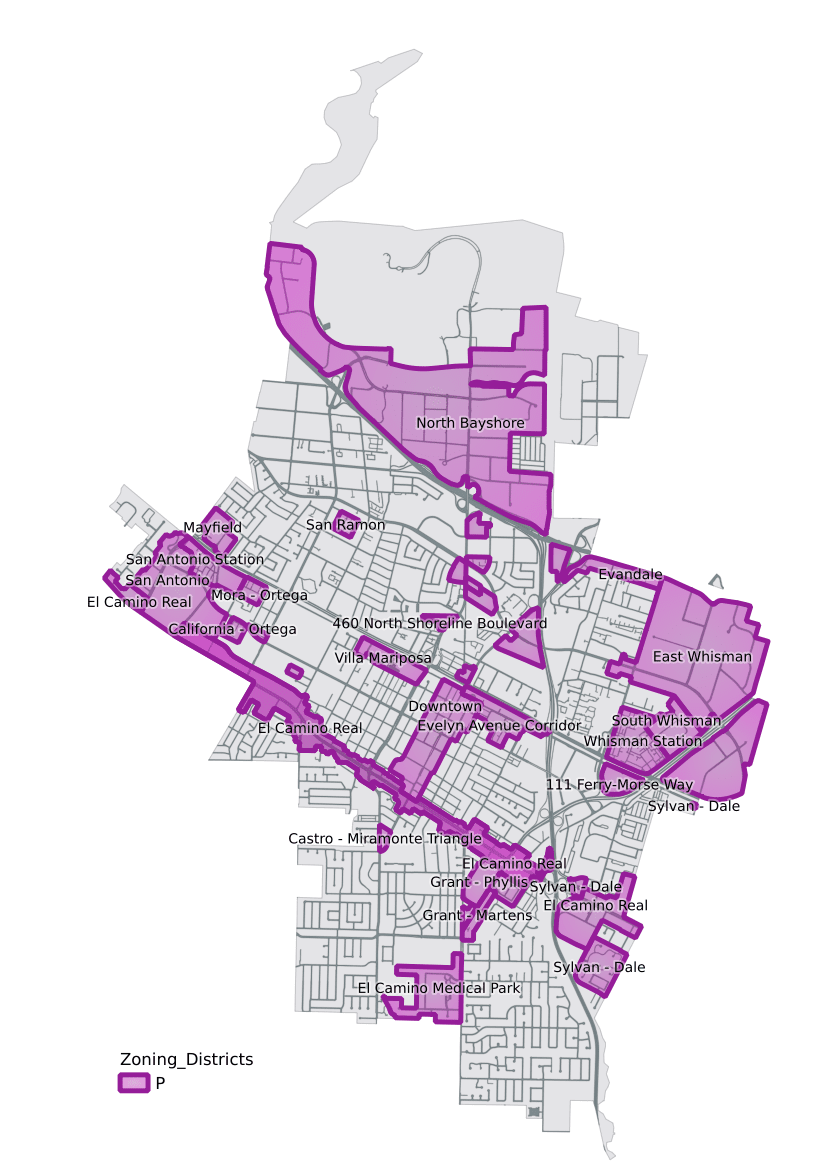
| Precise Plan Zones Of Mountain View |
Mountain View has many precise plans, for various regions and for many reasons.
| Zoning Label | Precise Plan Name | Last Updated | notes |
|---|---|---|---|
| P(5) | 460 North Shoreline Boulevard | January 2018 | 170 residential units |
| P(6) | San Ramon | January 1986 | R3-2.2 and senior housing |
| P(7) | Mayfield | June 2006 | Mixed-use |
| P(8) | San Antonio Station | December 2014 | Mixed use – mostly residential |
| P(13) | California - Ortega | June 1987 | R3-3 and senior housing |
| P(14) | 2100 California Street | April 1986 | residential |
| P(17) | Villa Mariposa | June 2019 | Mixed use |
| P(18) | Evelyn Avenue Corridor | April 2010 | Mixed use |
| P(19) | Downtown | June 2019 | Mixed use |
| P(23) | Castro - Miramonte Triangle | March 1975 | Office |
| P(24) | El Camino Medical Park | April 2005 | Office/medical |
| P(25) | Grant - Phyllis Triangle | March 1977 | mixed use |
| P(26) | Grant - Martens | January 2003 | mixed use |
| P(27) | Grant - Phyllis | July 1986 | retail |
| P(28) | 1101 Grant Road | March 1977 | R1 and senior housing |
| P(29) | 111 Ferry-Morse Way | July 1985 | industrial |
| P(30) | Sylvan - Dale | March 2005 | N/A |
| P(31) | Mora - Ortega | February 2012 | residential |
| P(32) | Evandale | December 1997 | CN – commercial |
| P(35) | Whisman Station | August 2005 | residential |
| P(37) | South Whisman | June 2009 | Mixed Use |
| P(38) | El Camino Real | June 2019 | Mixed Use |
| P(39) | North Bayshore | October 2020 | mixed use (not built yet) webpage |
| P(40) | San Antonio | May 2019 | Mixed Use |
| P(41) | East Whisman | October 2020 | mixed use (not built yet) webpage |
Many of these allow for mixed use (residential along with commercial or office). Downtown and El Camino are probably the best known of these.
The two largest mixed use developments (39 and 41) are still in the planning phase. Plans are being submitted to council and public meetings are being held. Since they are not built yet I have not included them in address density calculations. There are no residential buildings in these areas now, as far as I know.
 |
|---|
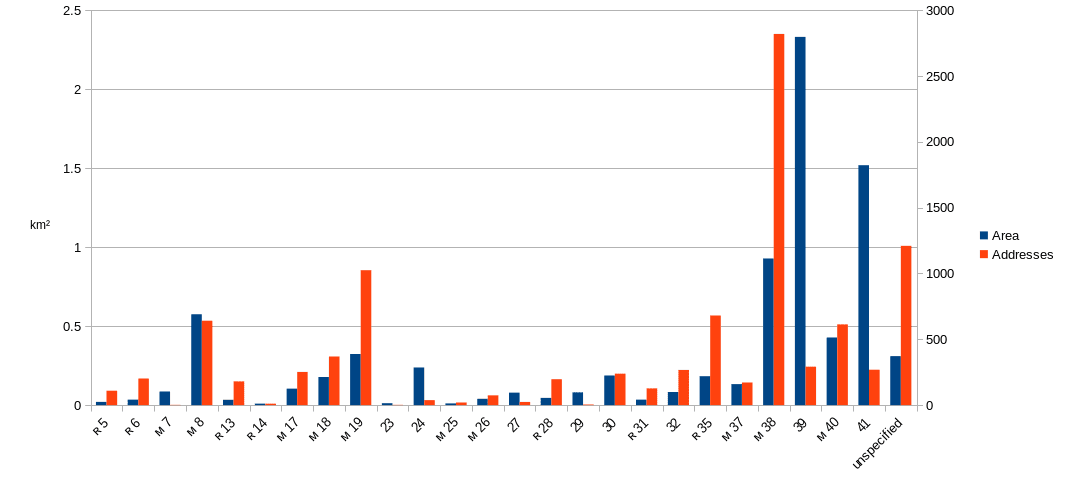
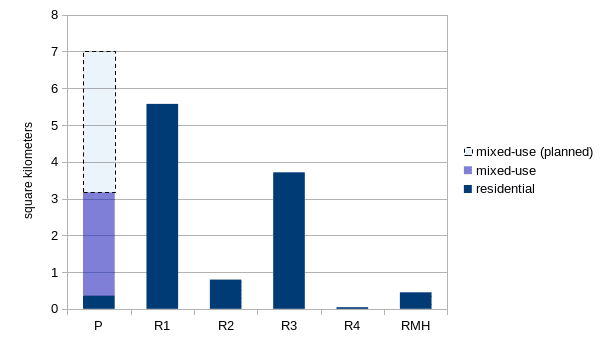
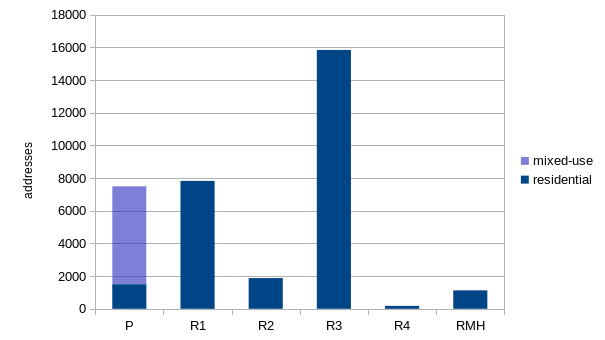
| R for Residential and M for Mixed Use |
2. Residential Zones
Now we can look at just the residential parts of mountain view
 |
 |
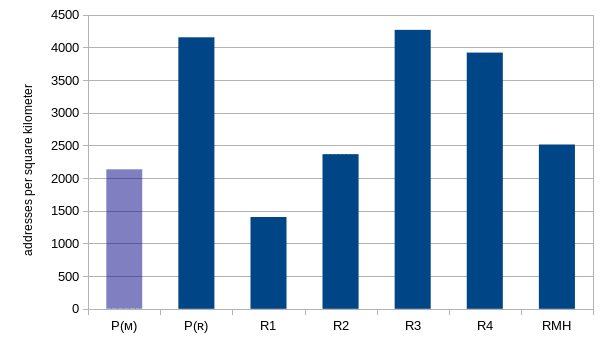 |
The two Google projects, East Whisman and North Bayshore, together make up an area equal to all R3 zoning currently in Mountain View
Existing residential precise plans are mostly modifications of R3 zoning, to allow for senior housing or other considerations, and so have similar density.
Existing mixed-use plans have low density. The San Antonio mixed use zone is more than half parking lot by area, so this makes sense. Wal-mart is not dense.
The East Whisman plan hopes to build 6000 homes in 1.5 square kilometers, bringing it up to nearly the same density as existing R3.
3. The City’s Plan
To comply with the RHNA of 11,000 homes, the city seems to be relying on two things:
- East Whisman and North Bayshore bringing new housing to office/commercial zones
- R3 Zone update increasing density in existing R3 areas
East Whisman and North Bayshore are both very large projects, and together plan to add over 15,000 homes. But as neither of these projects have actually started any construction yet, it is doubtful all those homes will be built in the next eight years.
The R3 zone update will create four sub-zones for R3, each with increasing density
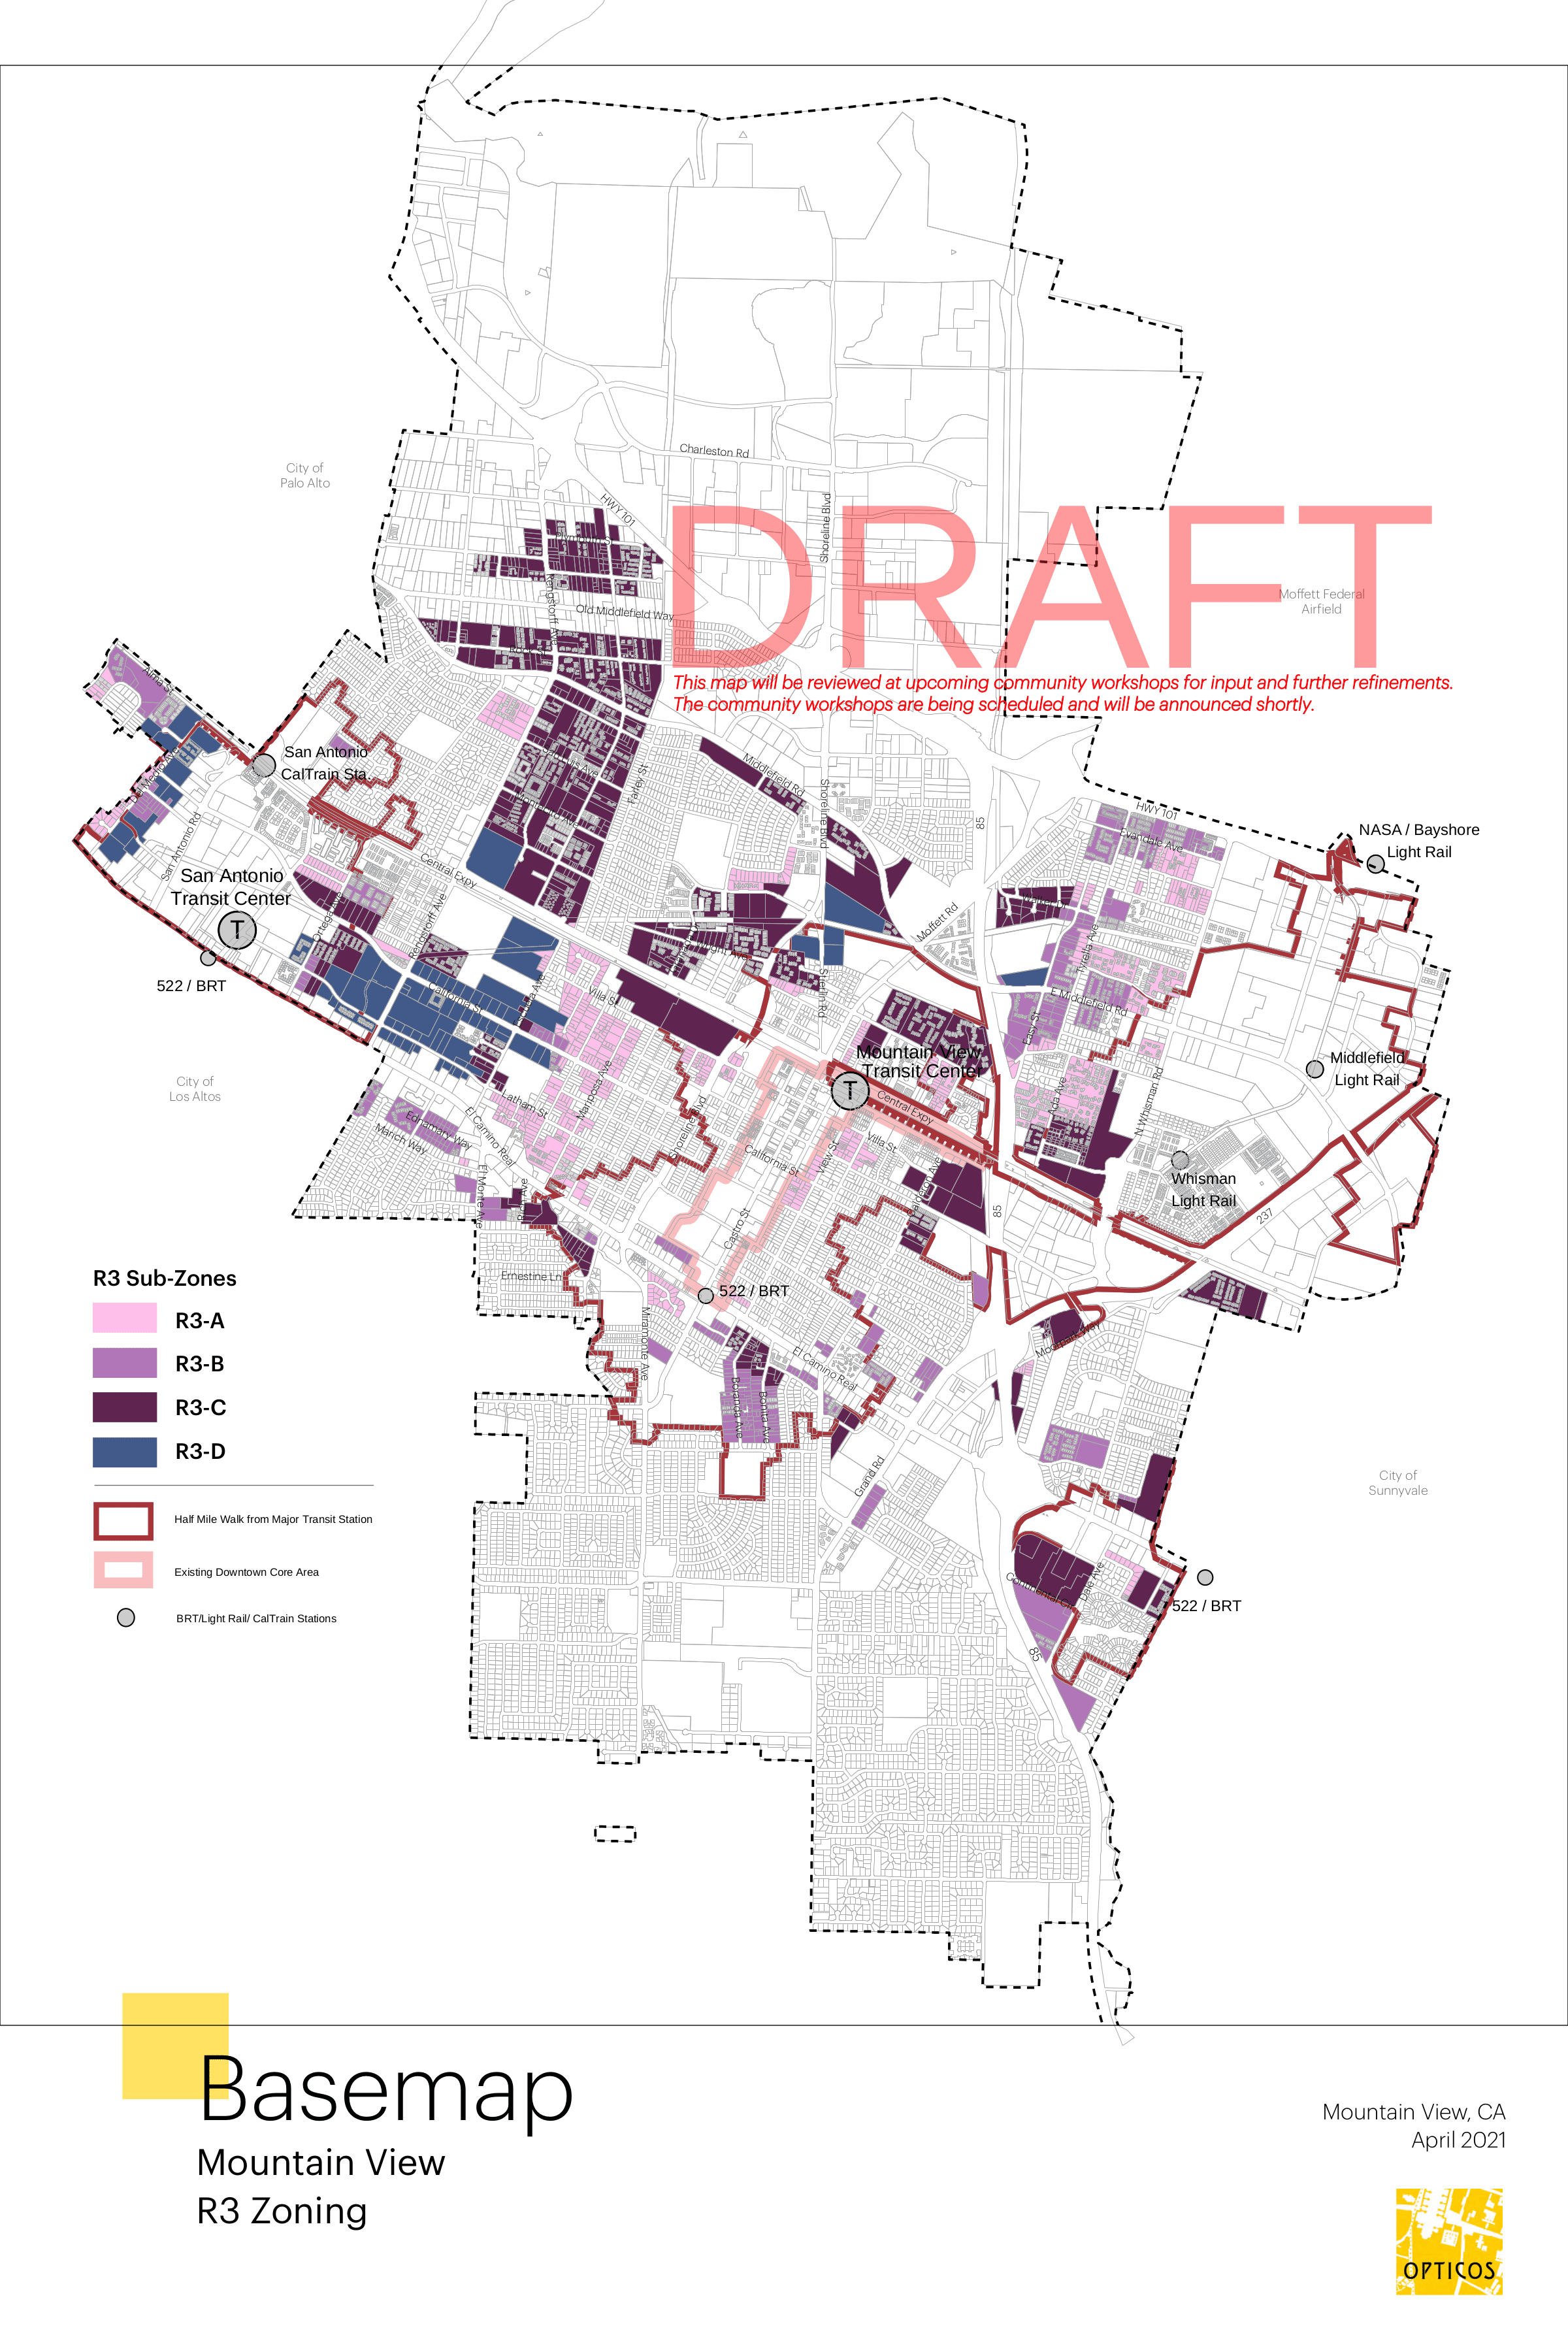 |
The update is mostly based on currently existing building types, but overall will result in an increase in allowed density. It is too complex for me to come up with a reasonable estimate of number of units.
Outside of these areas the city is working with other smaller projects, such as the lot 12 project, to increase the supply of affordable housing.
4. My Thoughts
The North Bayshore and East Whisman projects are good, in that I like the plans generally and they will add lots of housing with minimal displacement. I am wary a bit of a single company having so much dominance, but cautiously optimistic.
If you have thoughts on the project be sure to share them at the next public meeting, there is time to potentially shape these projects, and given the scale it would be effort well spent.
The R3 zoning update brings to mind the controversial 570 South Rengstorff project approved this week. Demolishing 70 rent-controlled apartments to build 85 million-dollar rowhouses doesn’t feel like a win for housing.
The city is attempting to solve this by adding rules about relocation or providing affordable housing on-site. It may help, but it still feels like attempting to fit all the new homes in existing R3 will mostly just cause gentrification.
I much prefer plans that replace existing commercial or industrial spaces with mixed-use housing. The city doesn’t need to wait for a developer to come along with a precise plan, zoning more areas like El Camino or Downtown will create more homes without uprooting existing families. Looking at the R3 map it seems Old Middlefield would be a good candidate.
With the passage of SB 9 duplexes will become legal everywhere essentially upzoning all R1 areas to R2. This could add as many as 8000 homes, though it probably will not have near that much affect. Most homeowners will not be converting their home to a duplex, and it is doubtful if many property owners will do either, as it is expensive and does not measurable increase home value. This will have a positive effect for density in the long term as new construction may more often decide to build duplexes, but it is doubtful there will be significant difference right away.
So it seems to me the majority of the new housing will be provided by the North Bayshore and East Whisman projects, and it is probably a good thing, as it may help the city stave off the gentrification of the little “naturally affordable” housing stock it has left.