Viewing Neighborhoods through Building Footprints
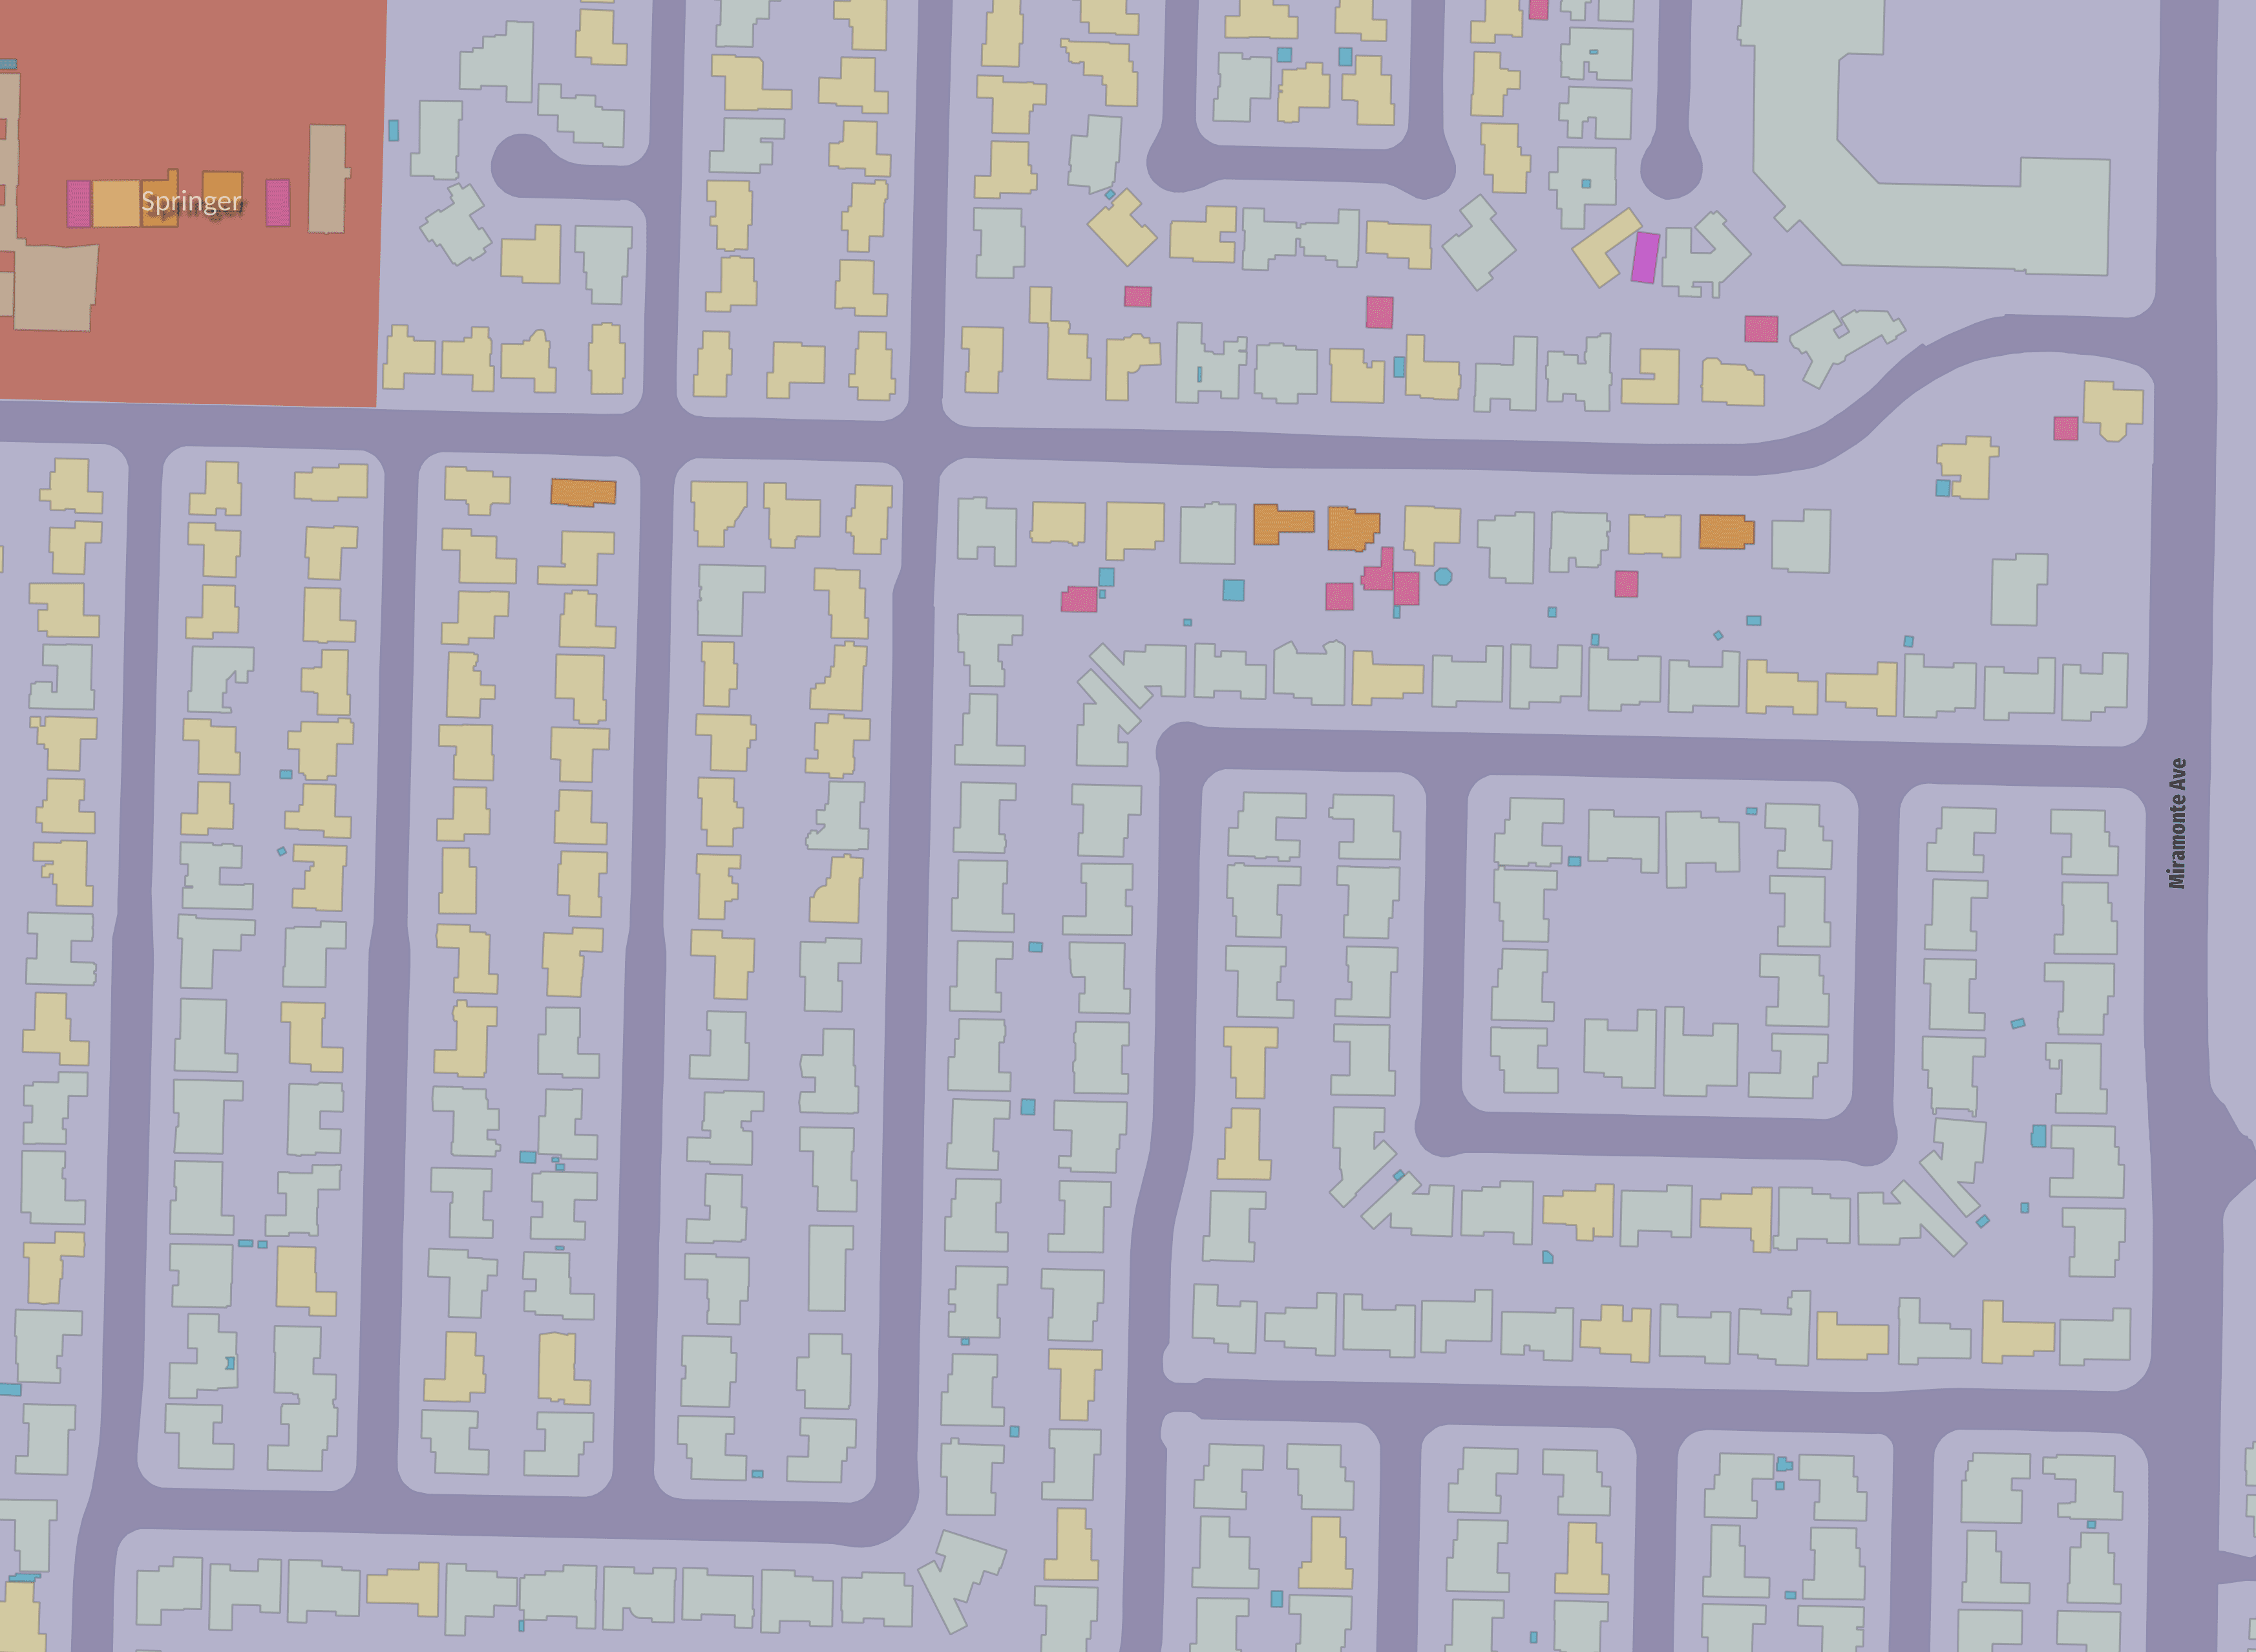
Coloring building footprint data from here reveals neeighborhood qualities.
- Under 500sqft - Teal
- Under 1000sqft - Red
- Under 1500sqft - Purple
- Under 2000sqft - Orange
- Under 3000sqft - Yellow
- Over 3000sqft - Grey
First we have the older neighborhoods near to downtown.
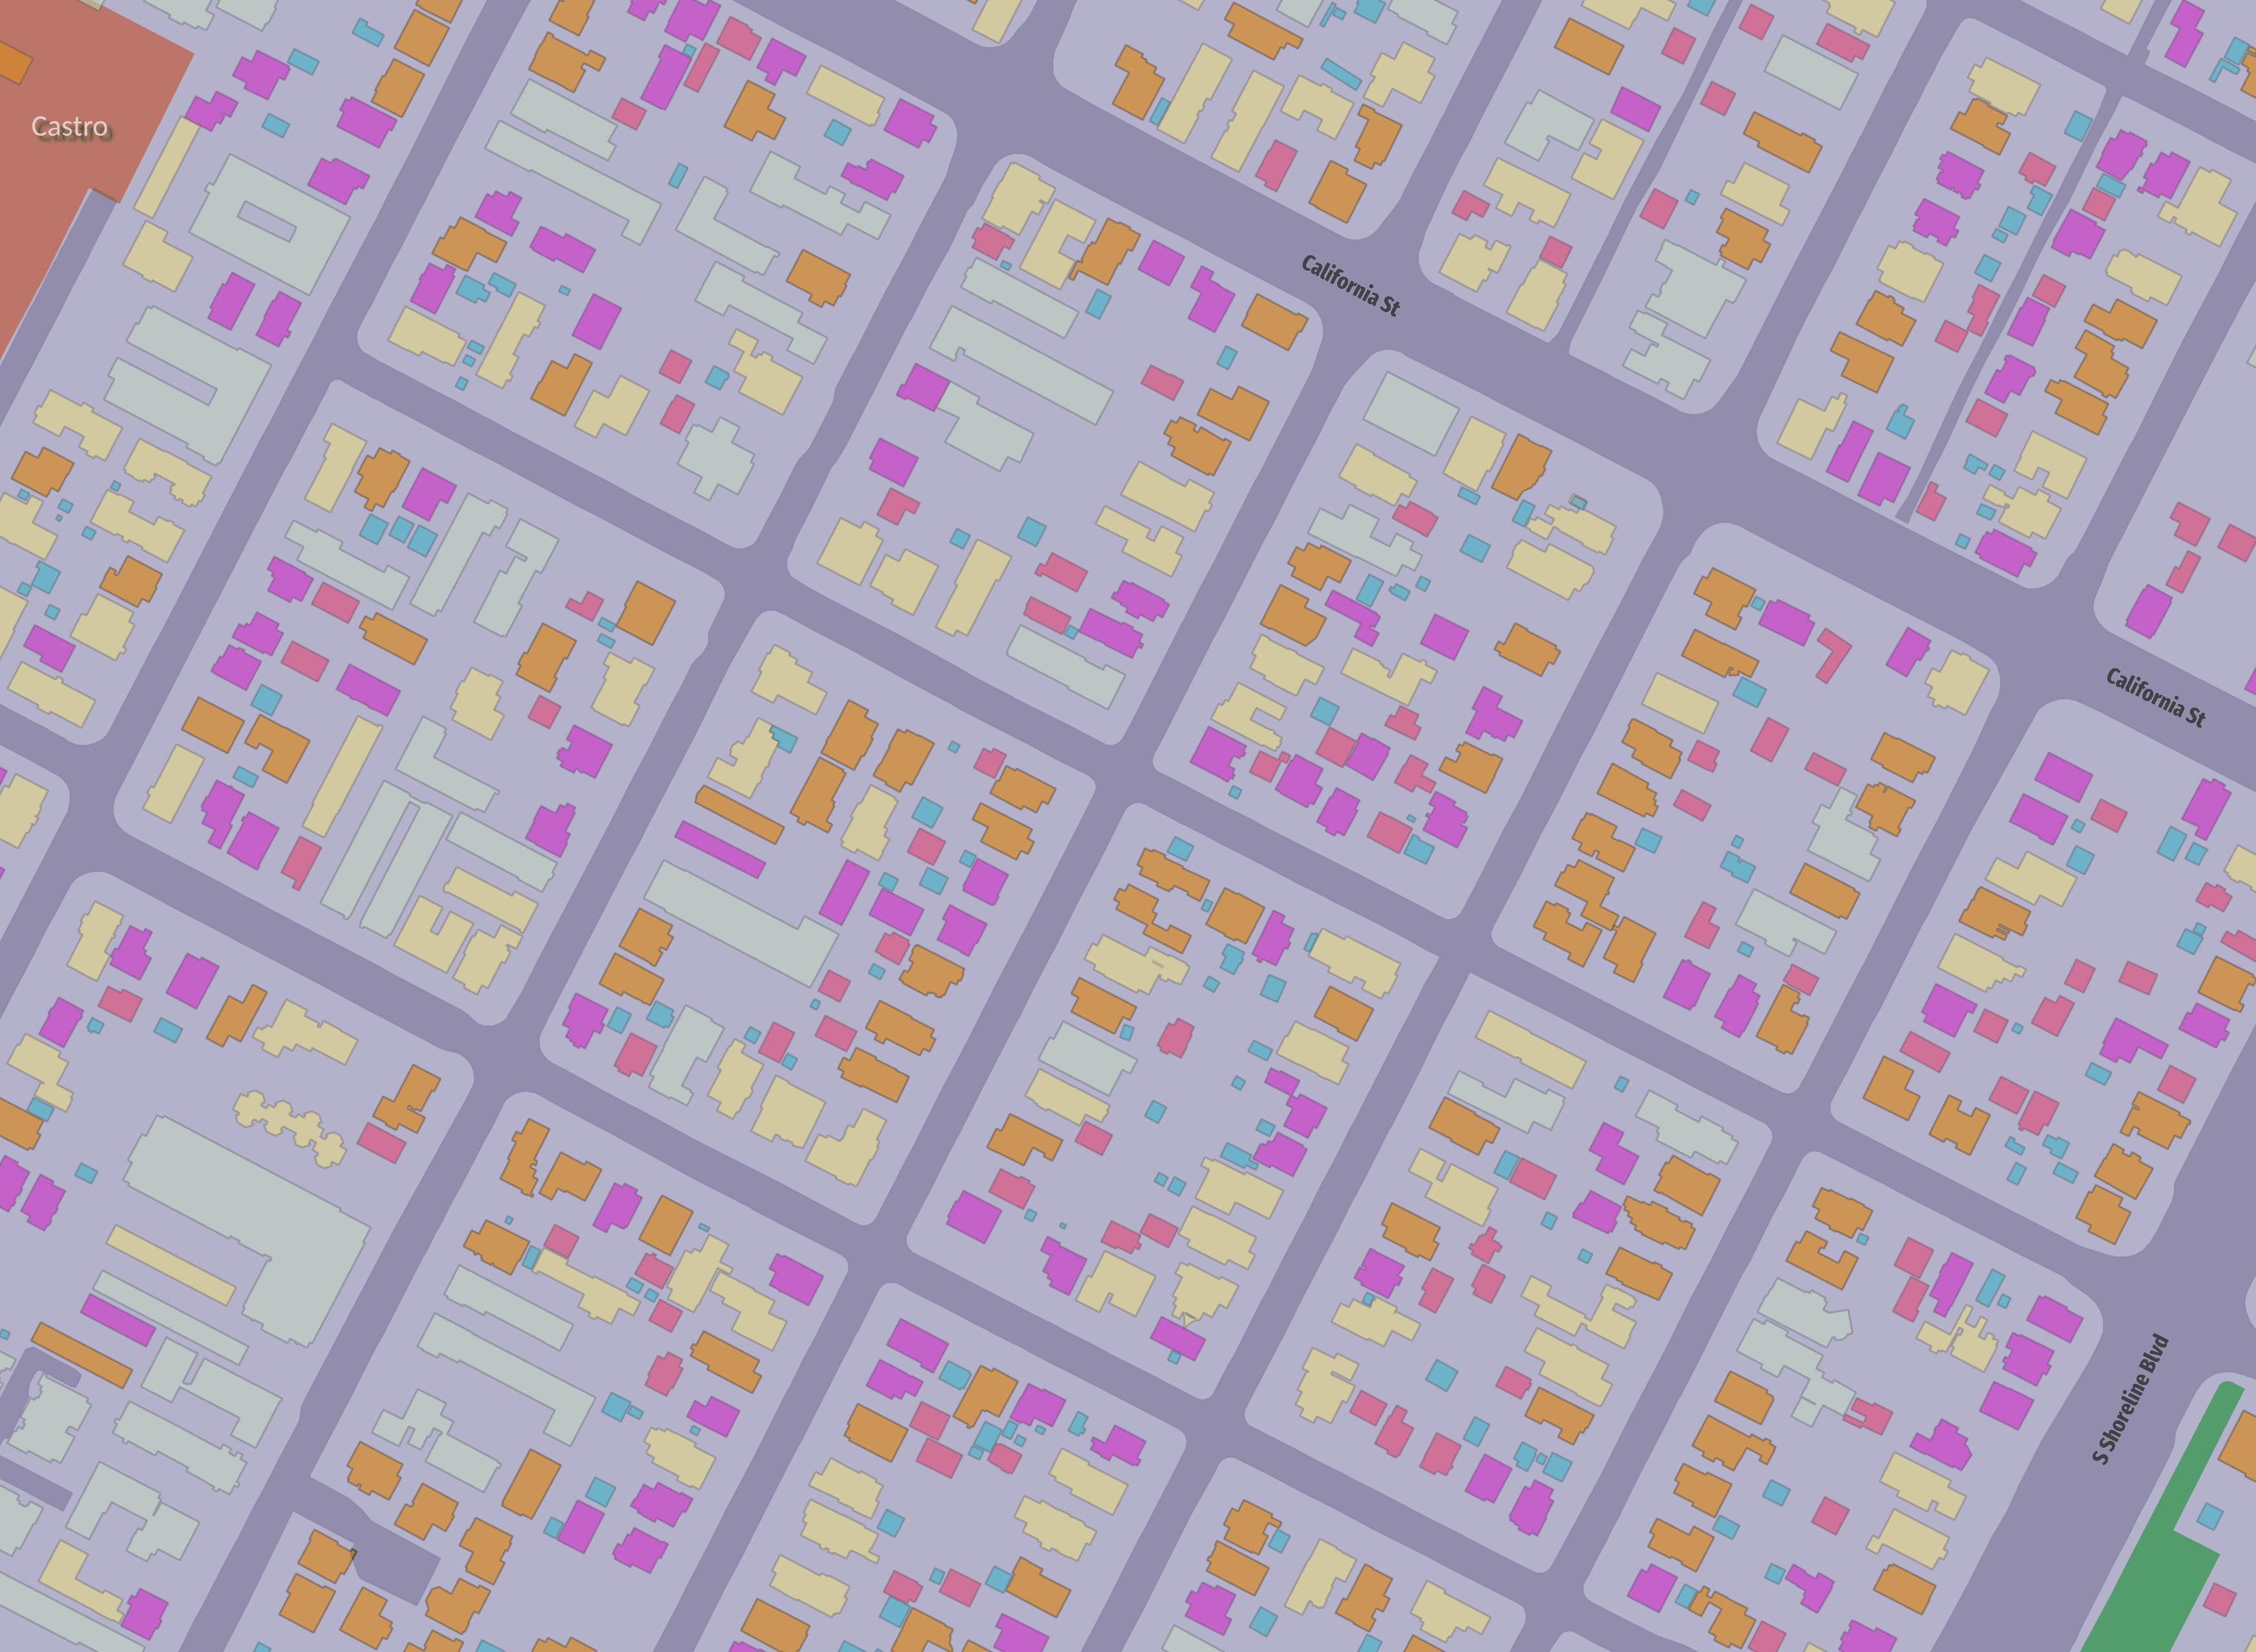
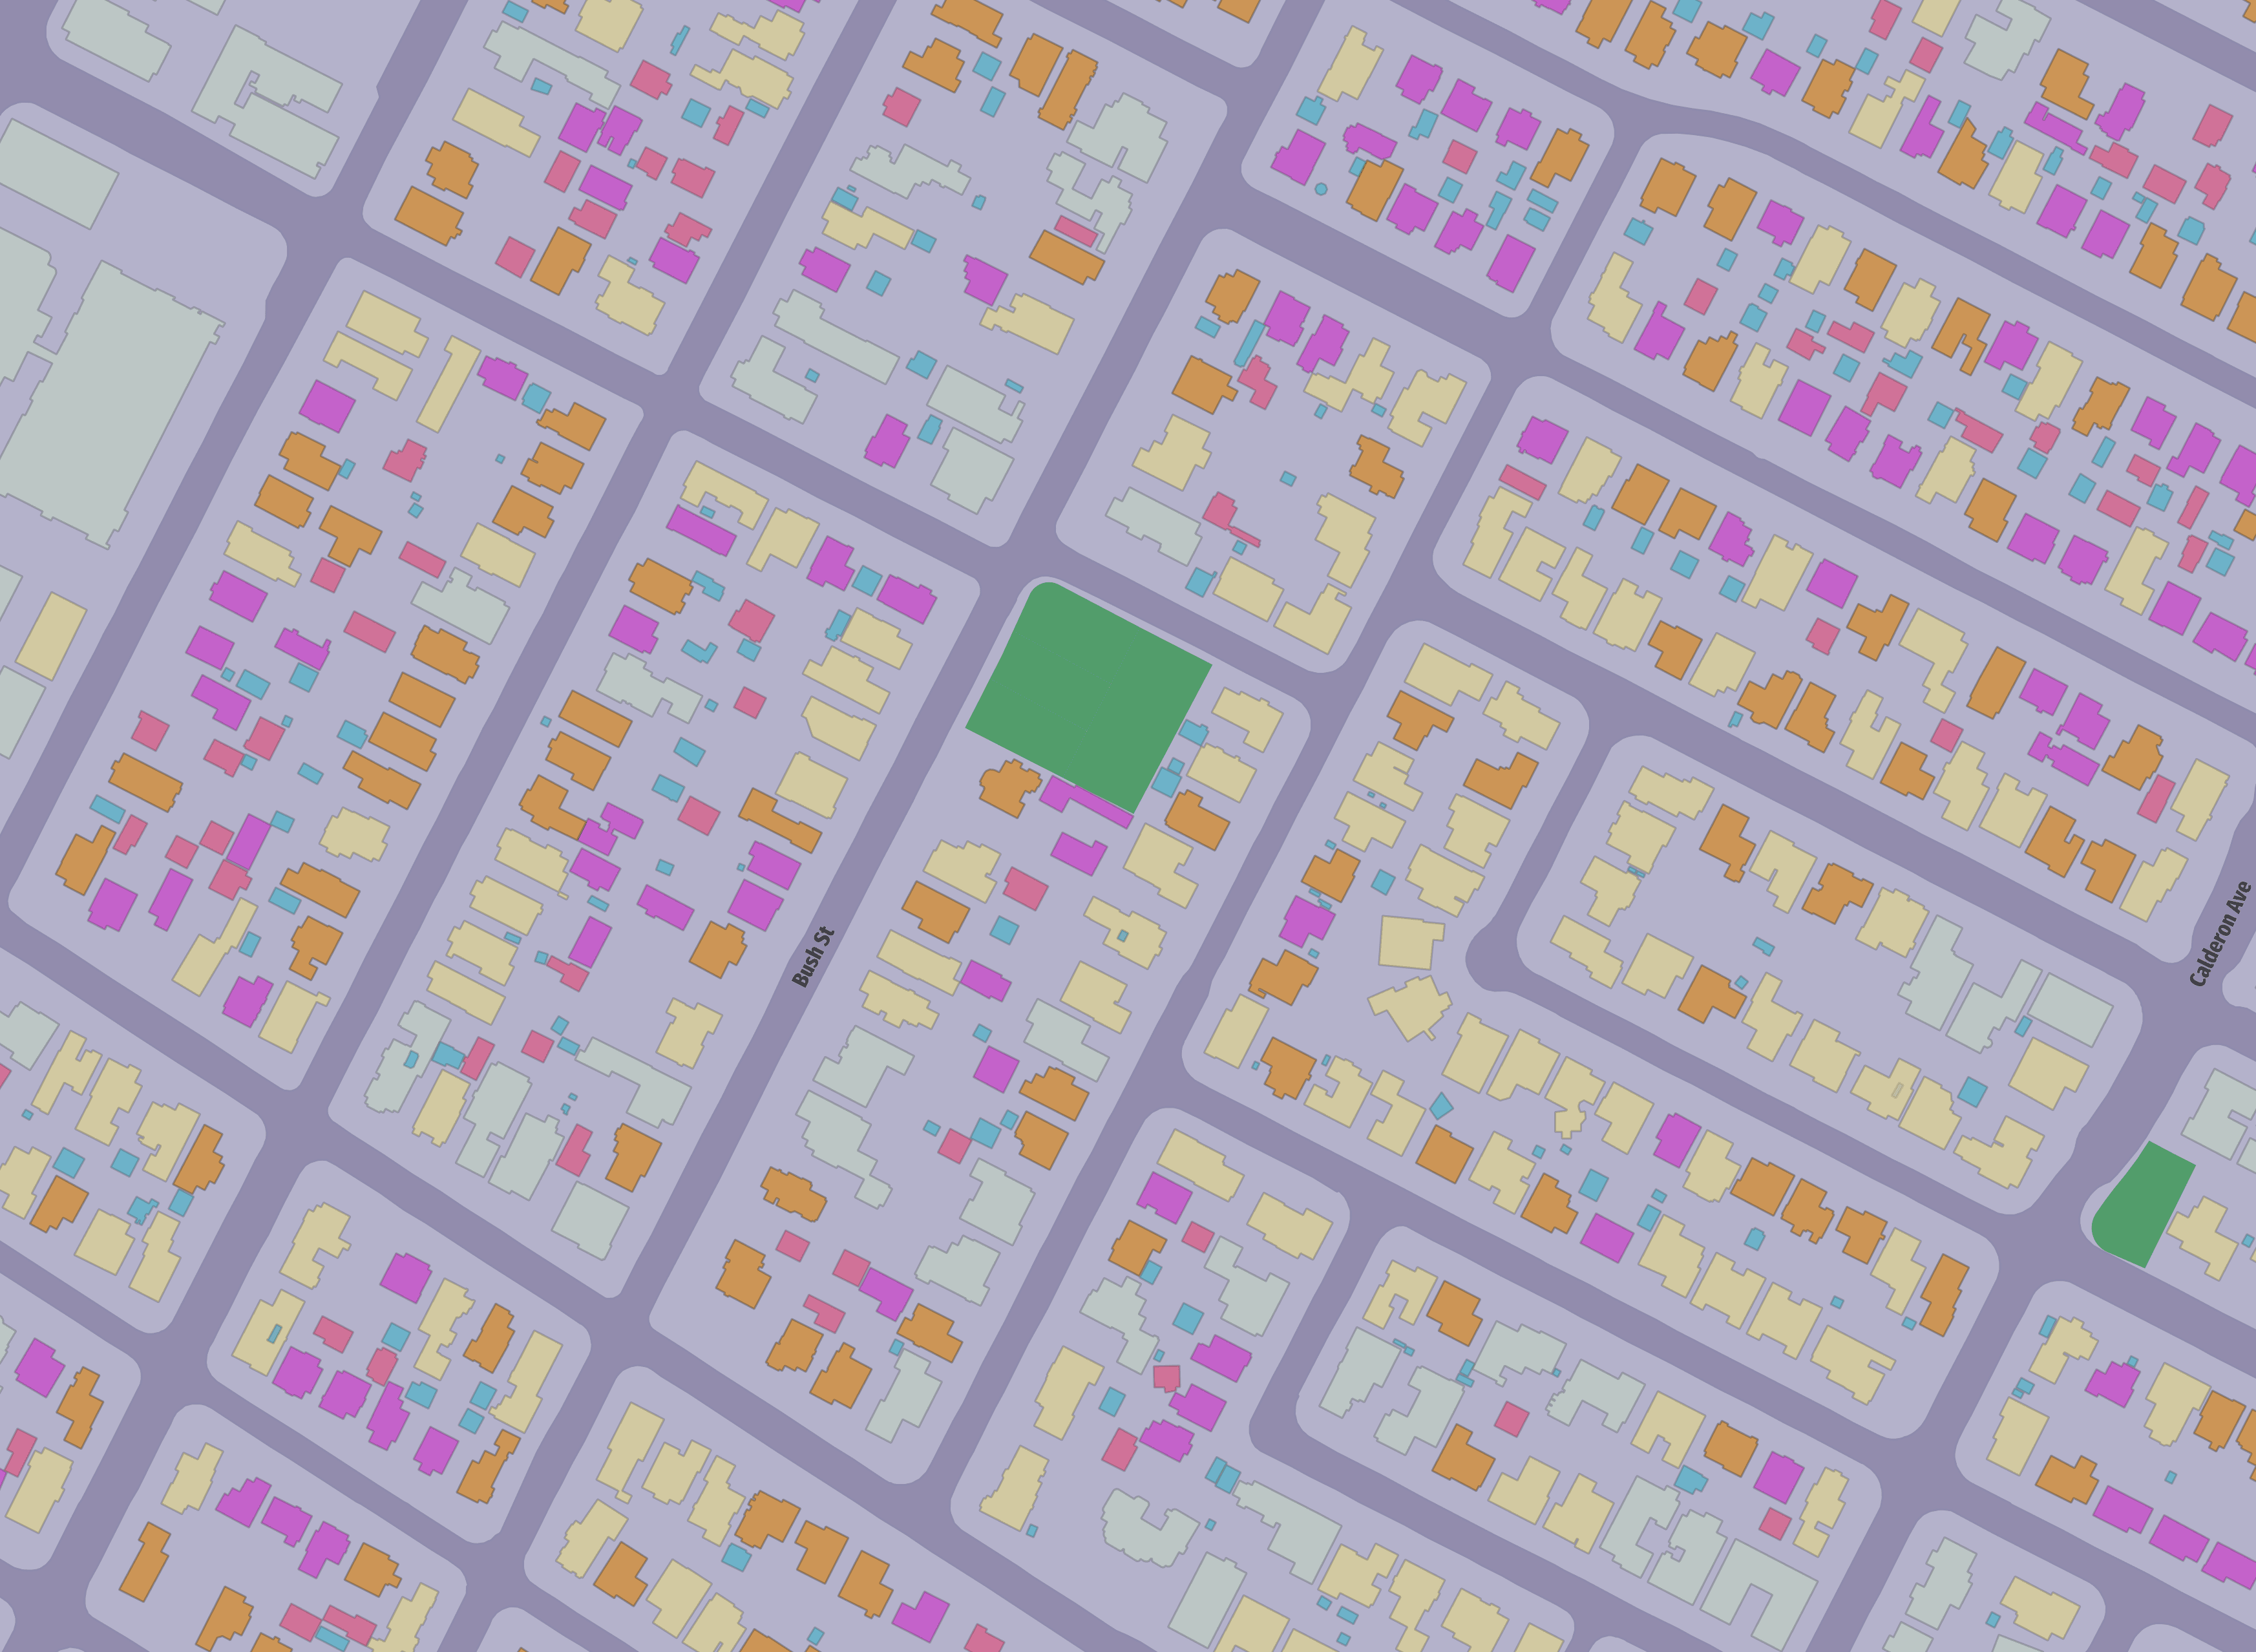
A mix of dwelling type. This area is full of older houses, which tend to be smaller. Also lots of small apartments, in-law units and the like. Before modern zoning this was typical.
The smaller blocks and narrower streets contribute to the walkability. These areas are also full of street trees, which adds to the pleasantness of walking.
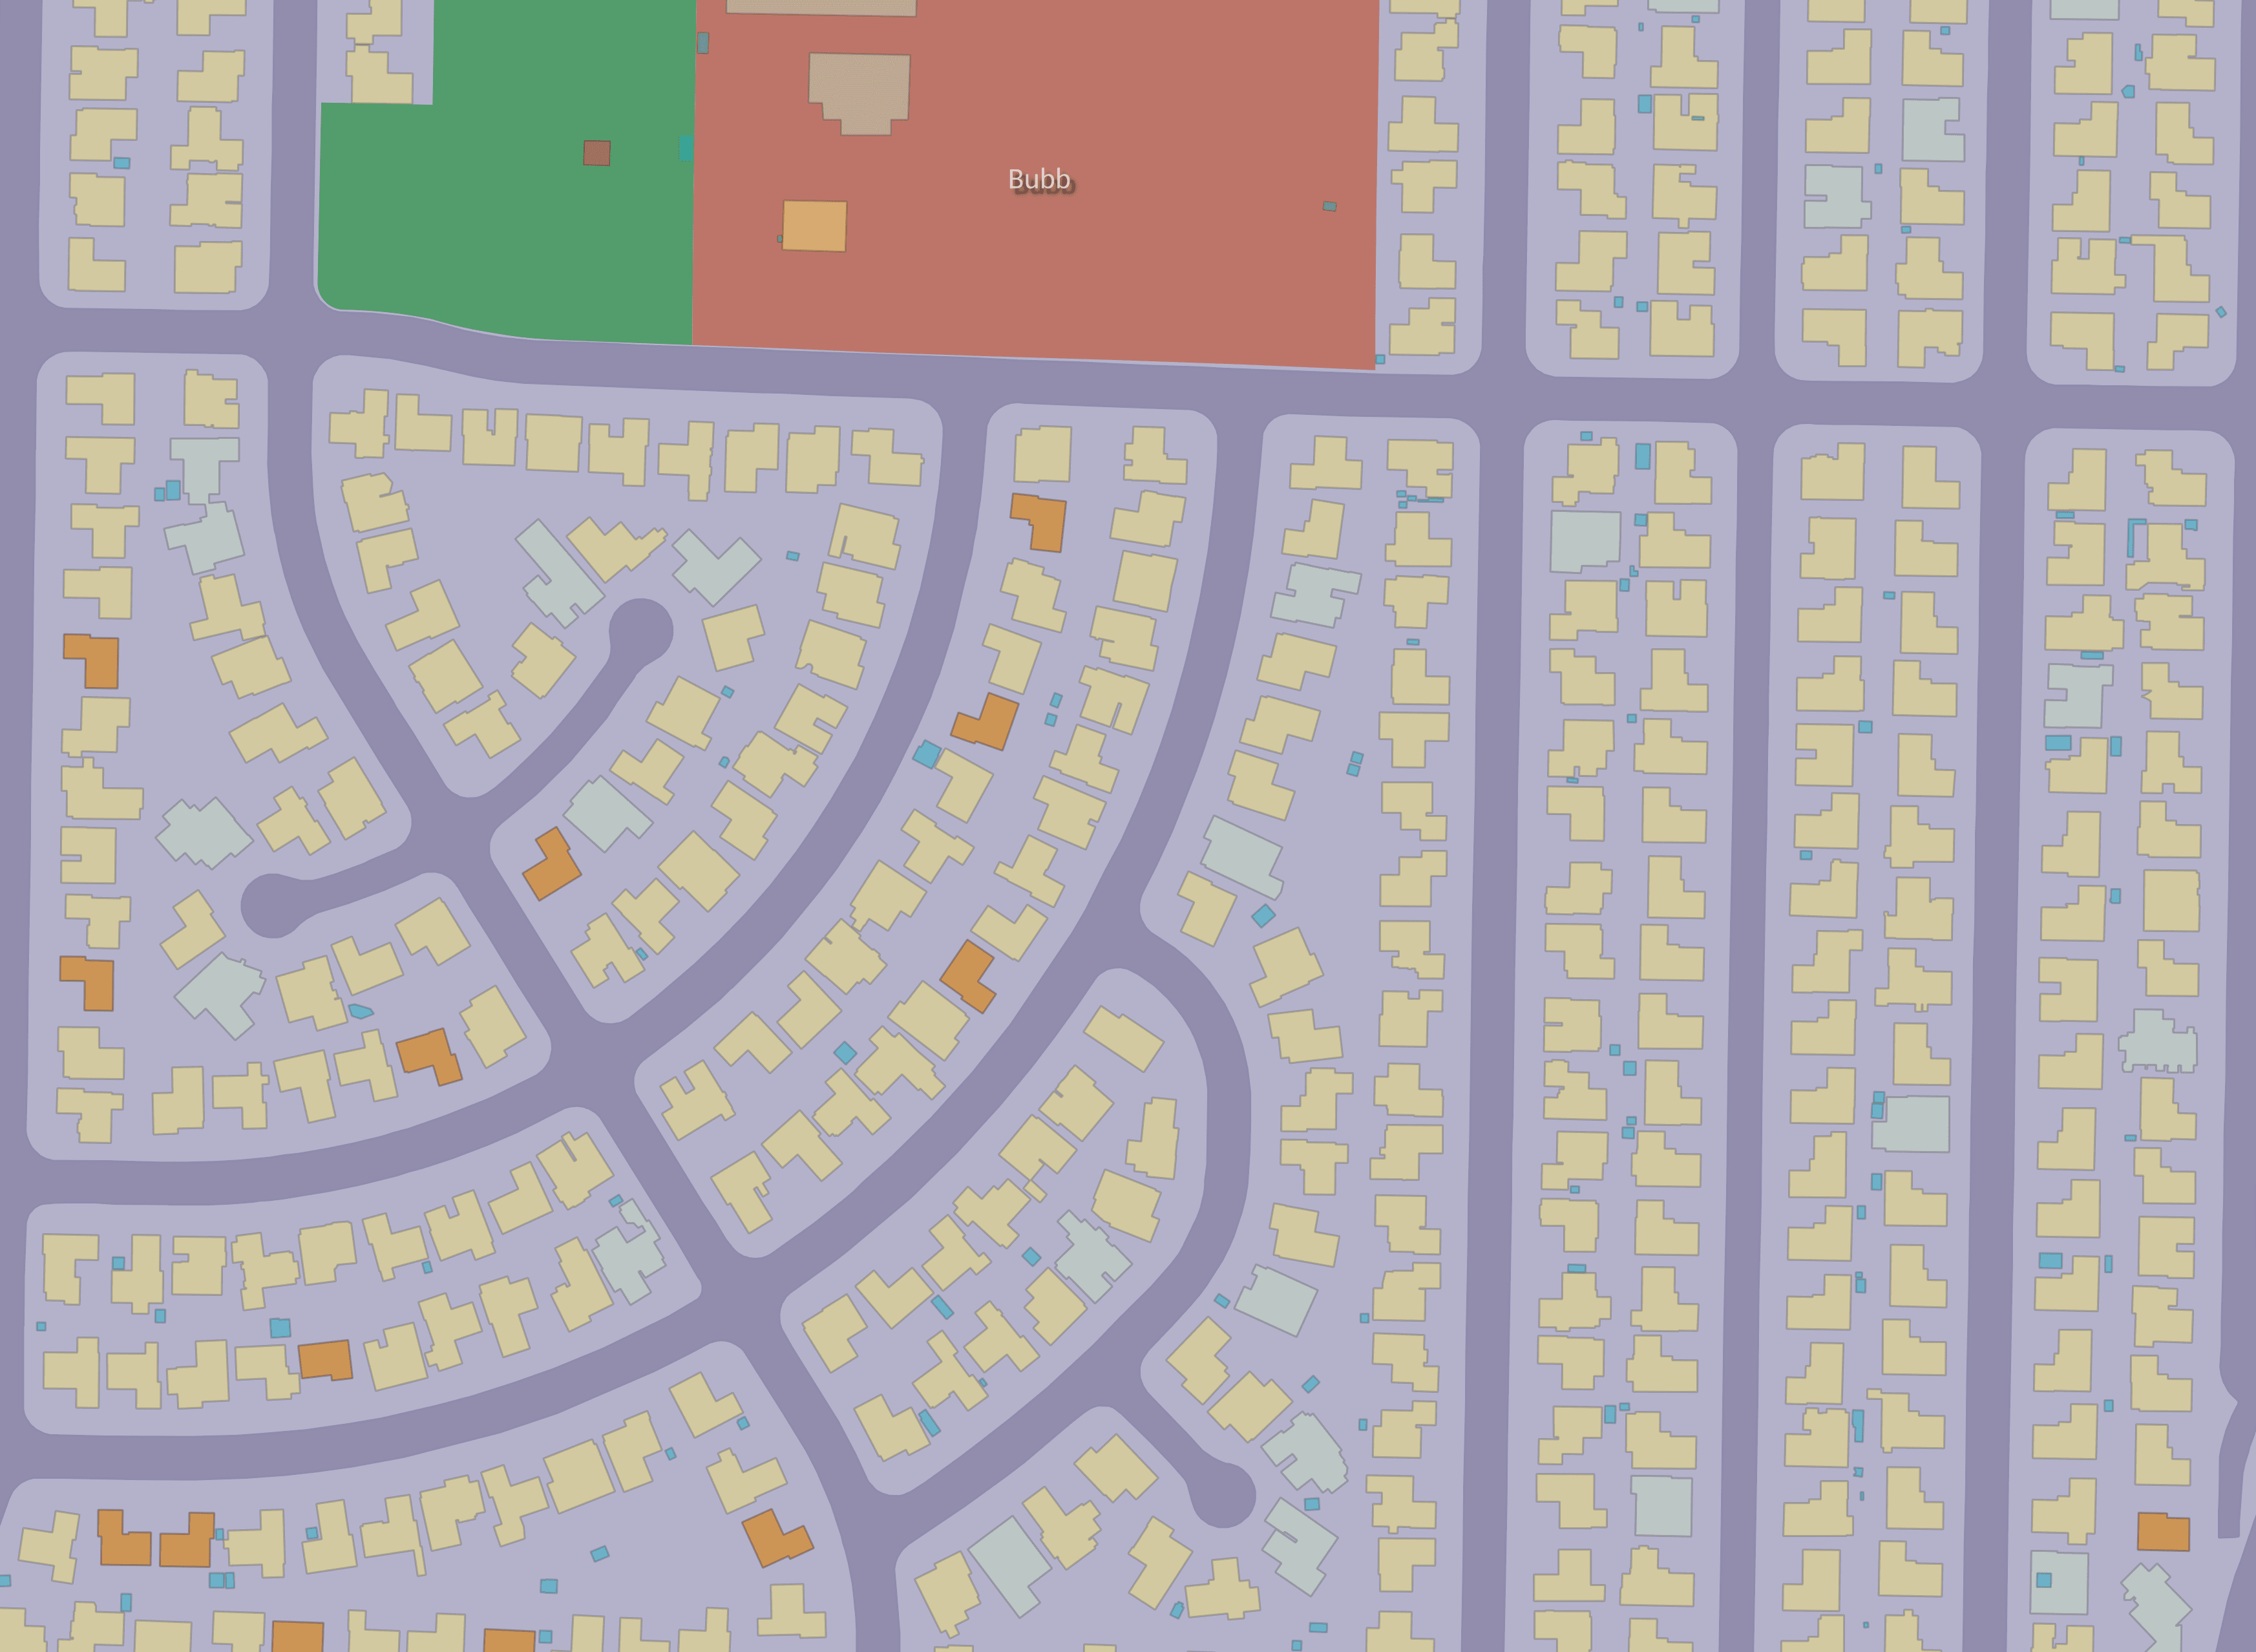
These neighborhoods are typical suburbia. Large blocks, cul-de-sacs, wide streets, and houses that are all the same size. There is no variety here.
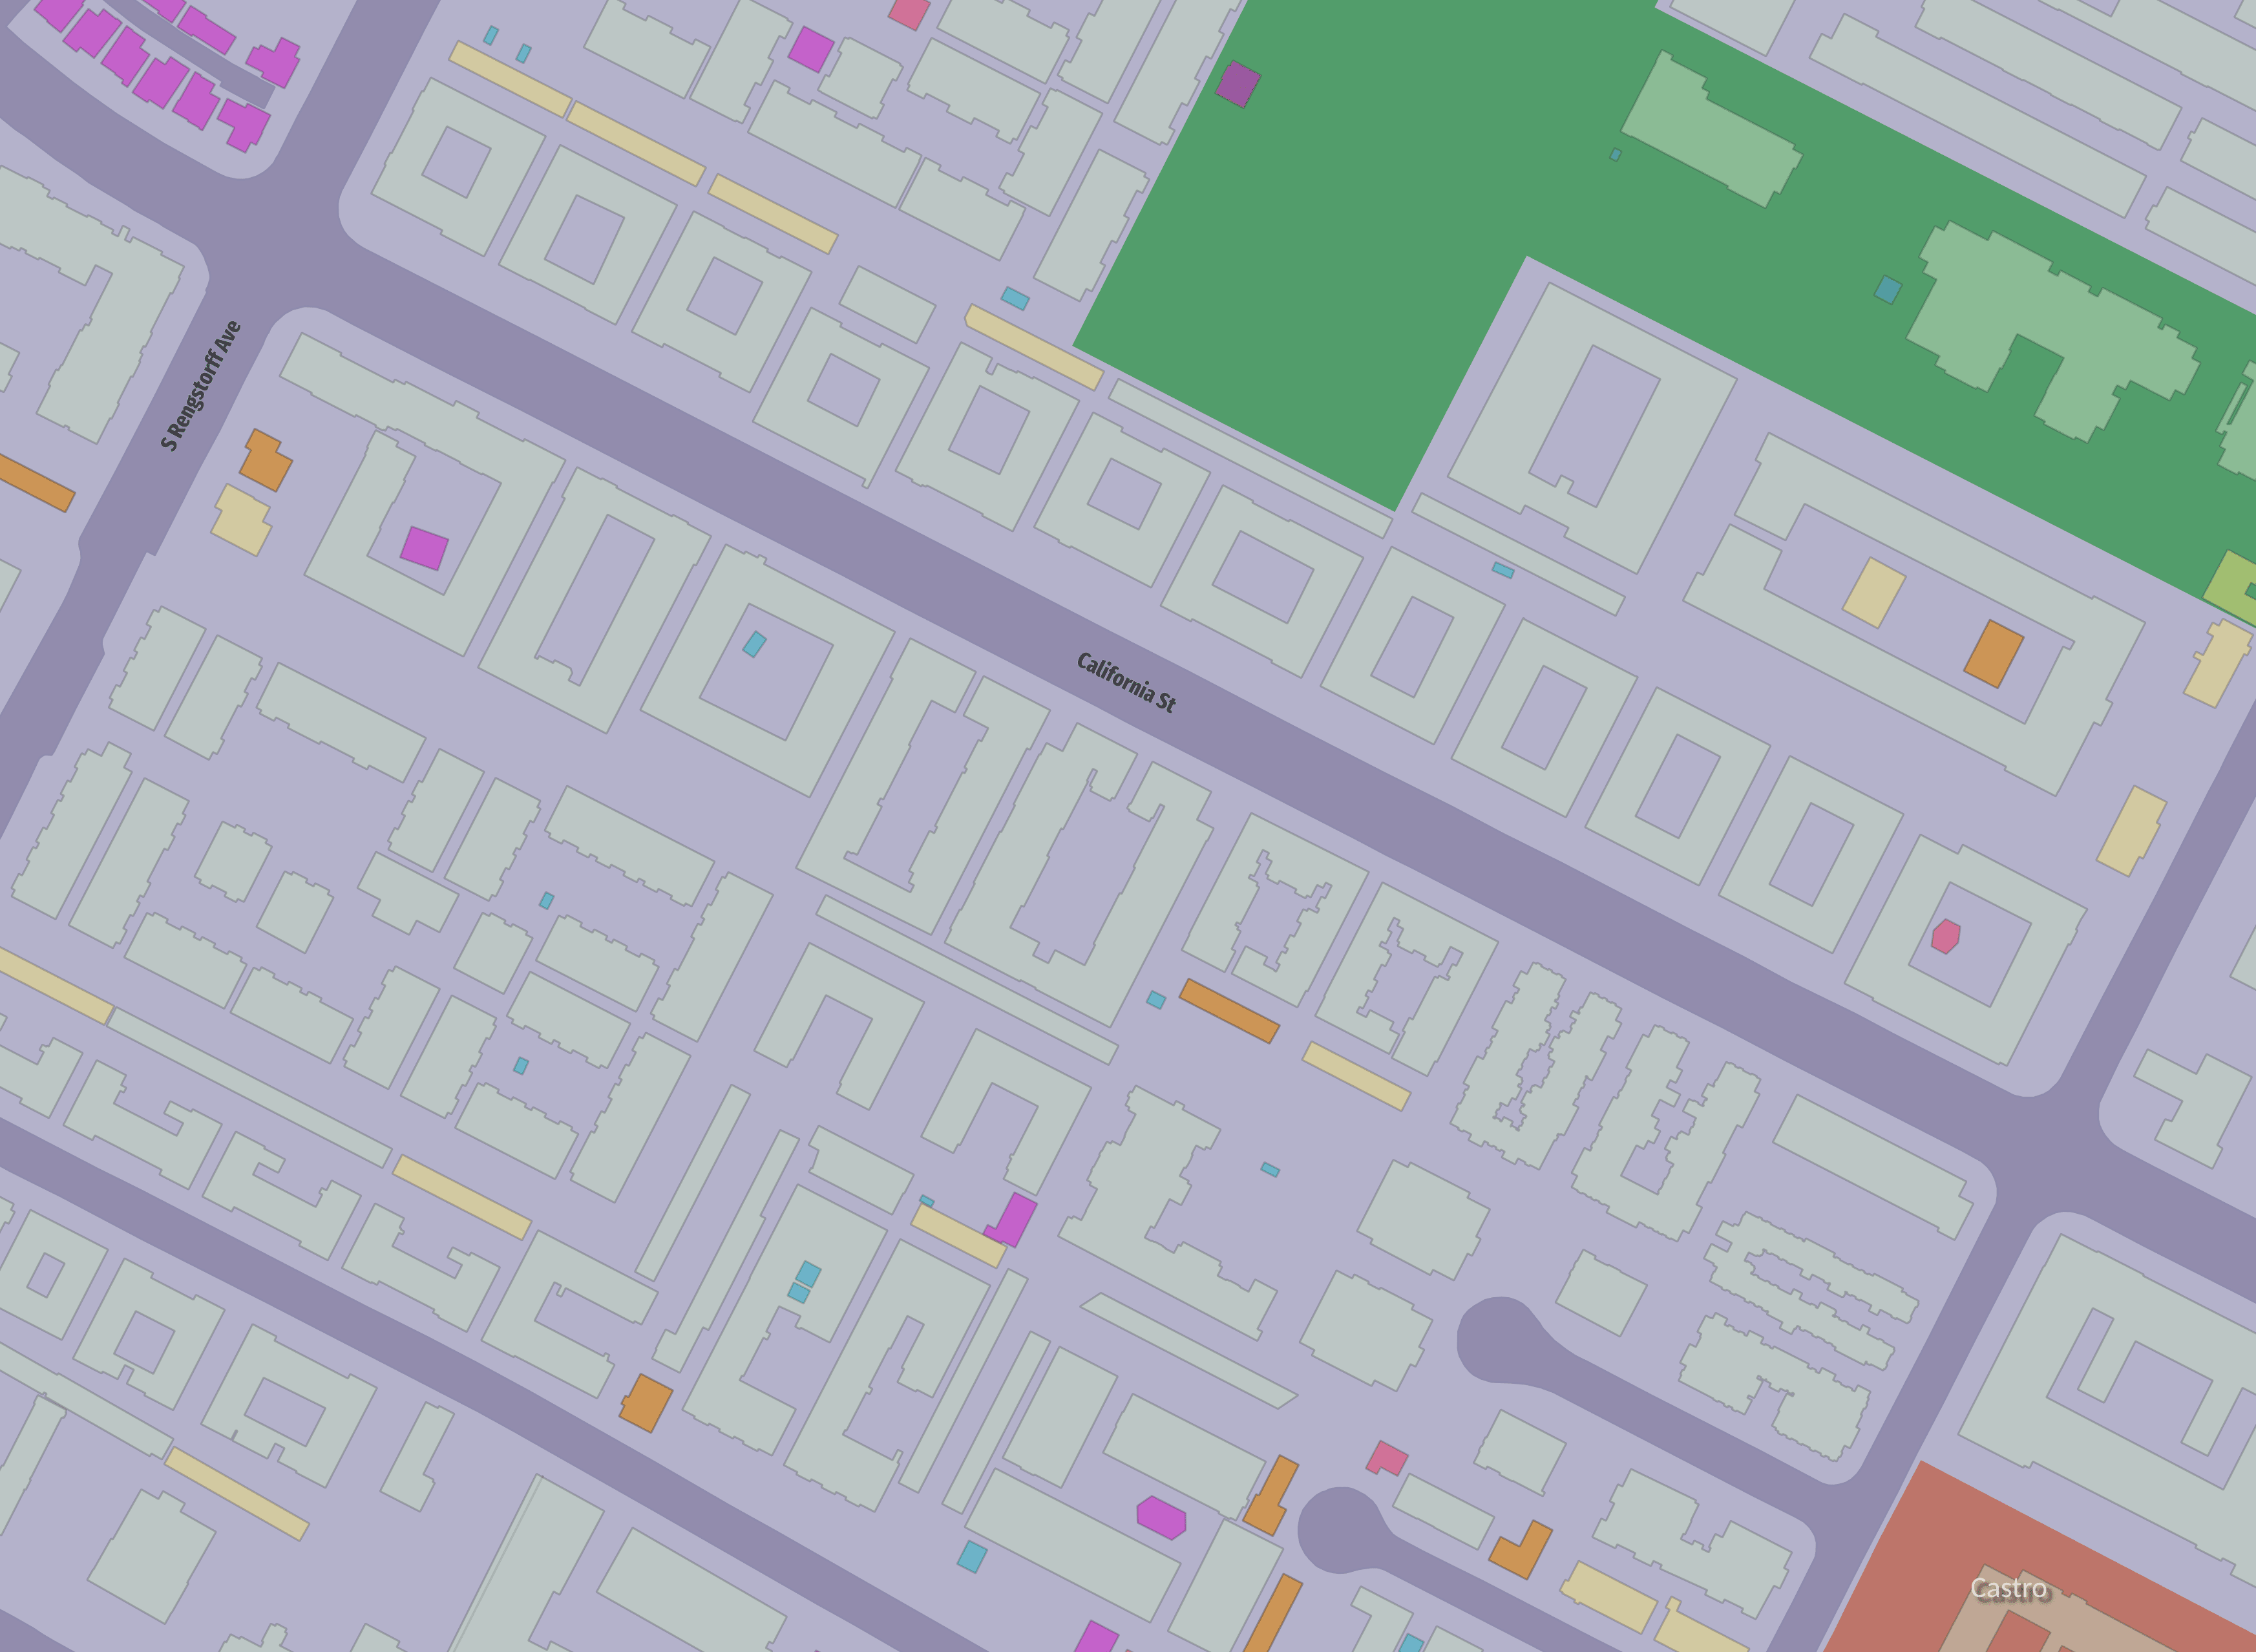
Here we have monotony of a different kind. Half way between the two train stations is the most densely populated area of the city, full of low-rise multifamily apartments and condos.
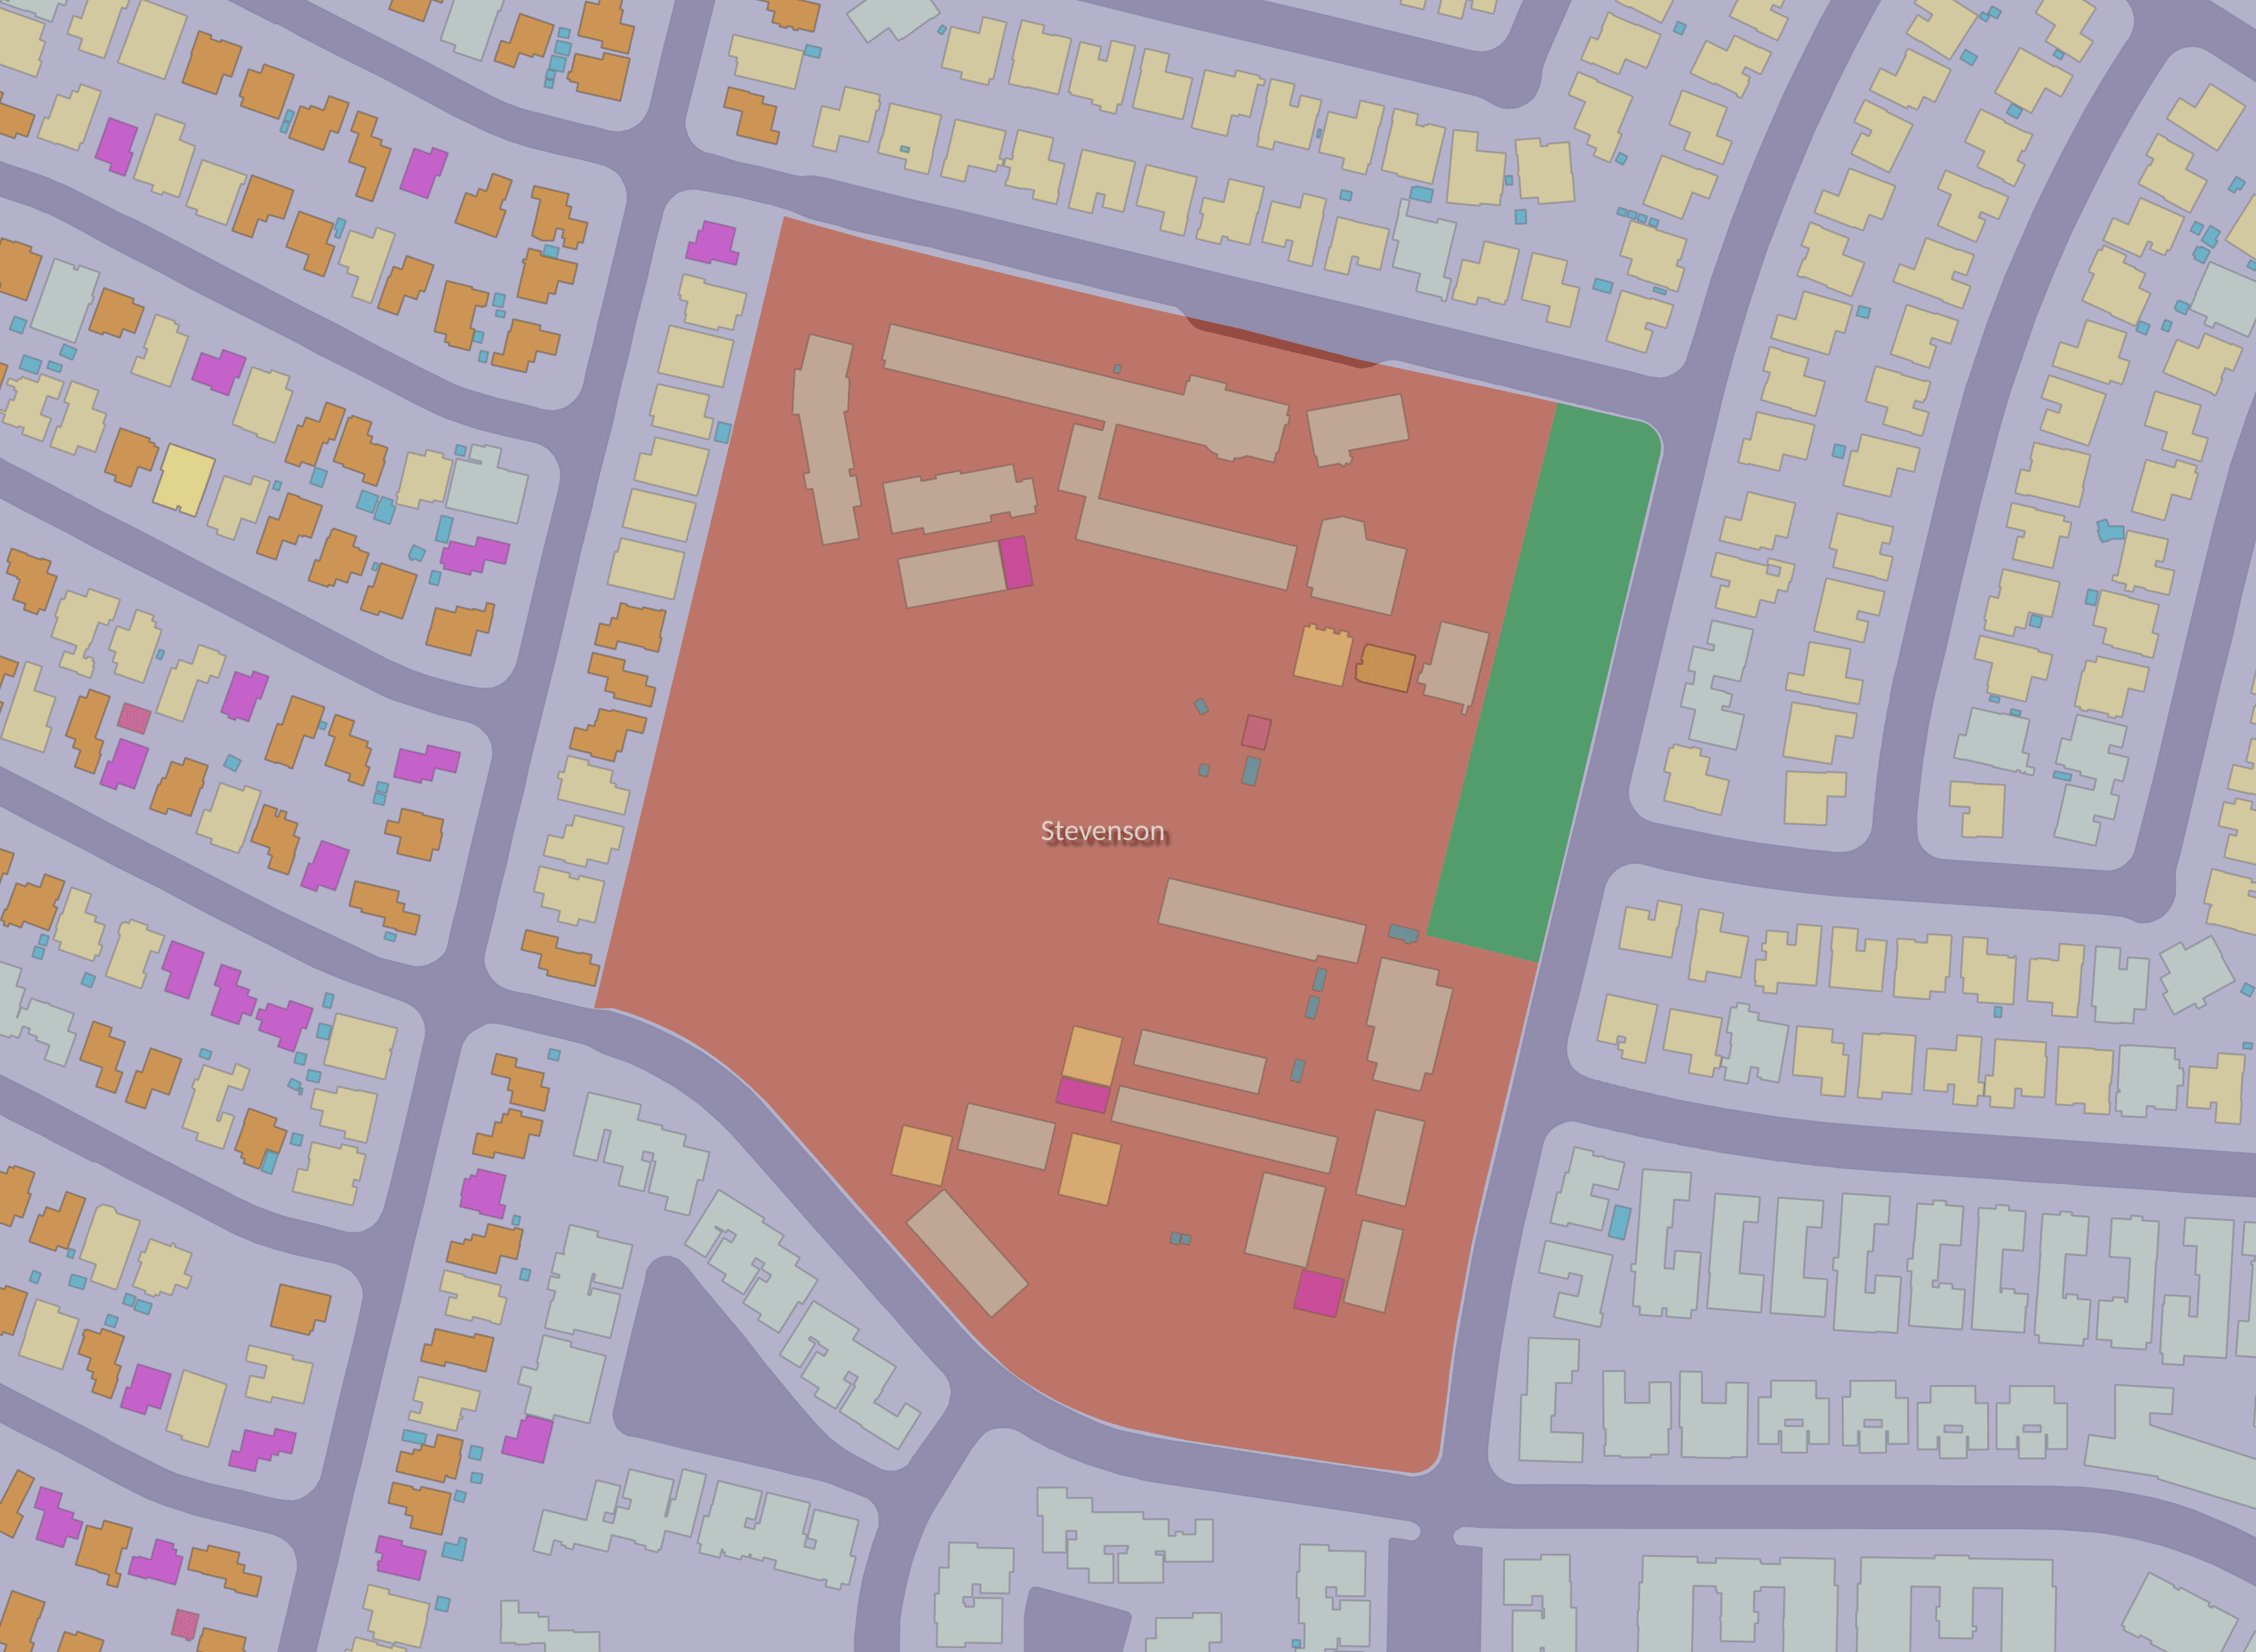
Around Stevenson Elementary we can see three distinct neighborhoods. West is a suburban development with smaller homes, North and East is a development with larger homes, and to the South are multifamily homes.
This highlights something I learned from Suburban Nation, That suburb developments are typically targeted at a very narrow income bracket. Developers seem to believe that homogeneity is something buyers desire.
Personally I am happy to live in a traditional neighborhood with a diversity of housing types.
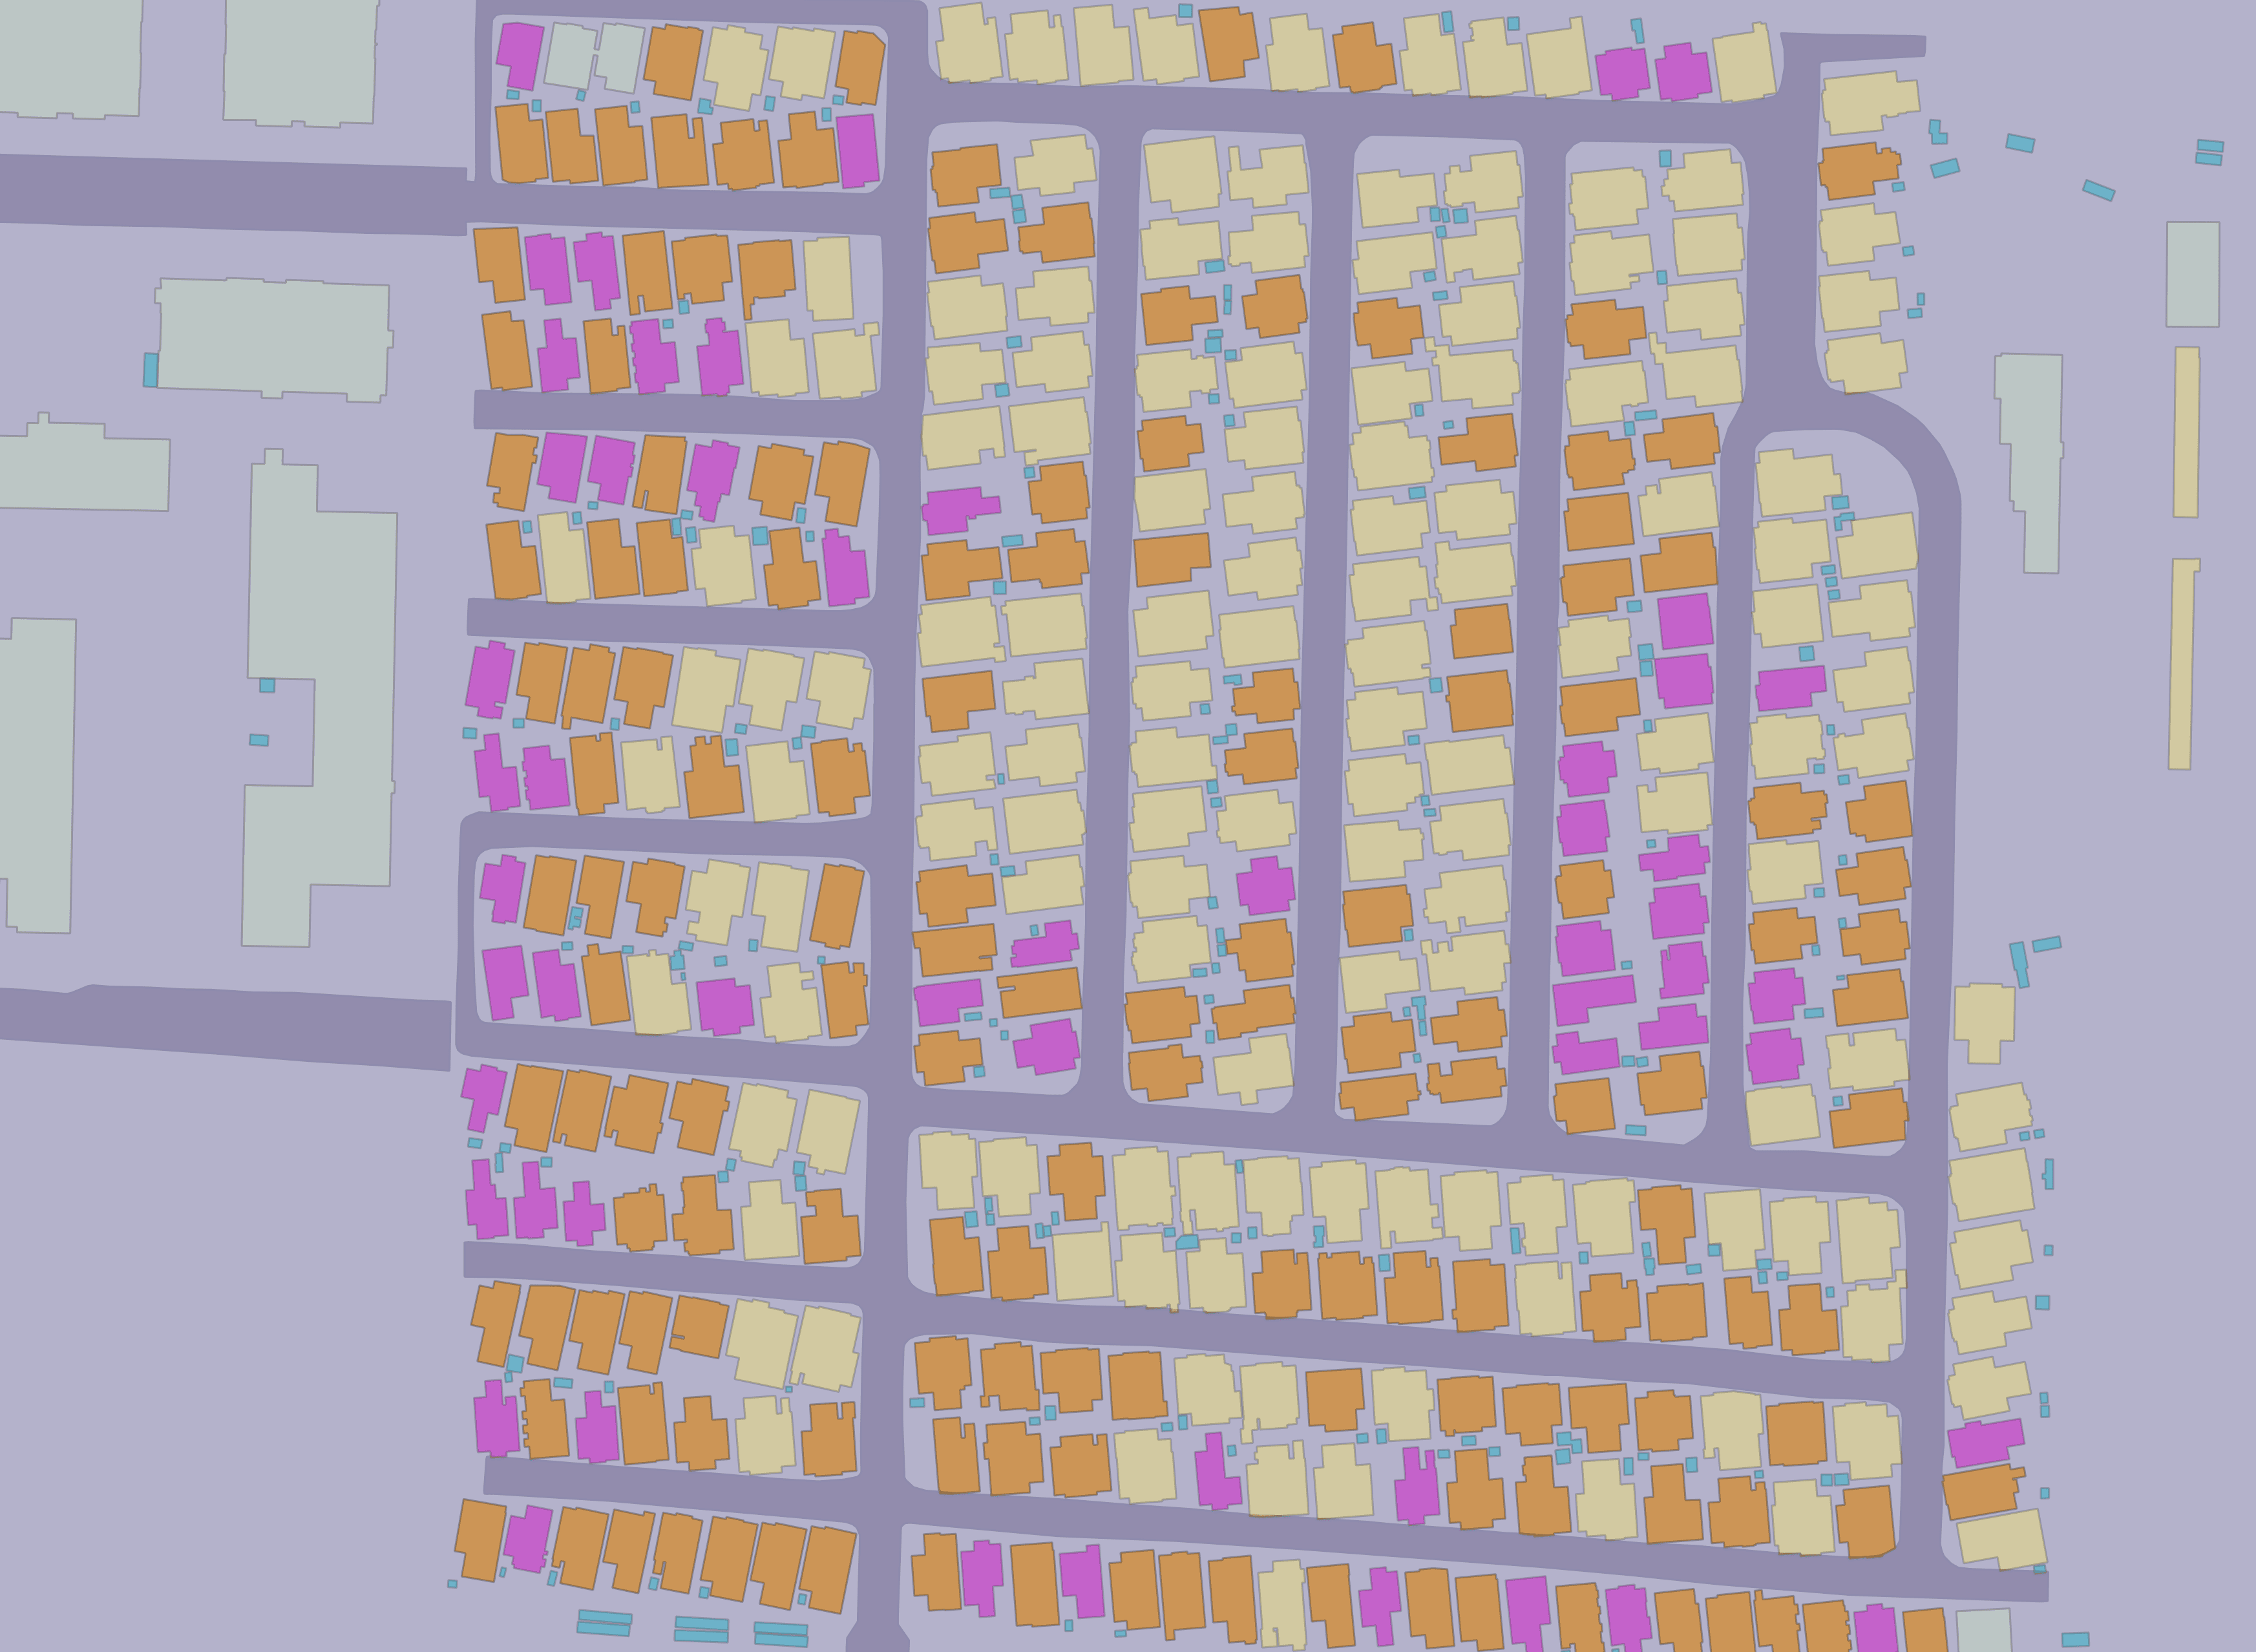
Santiago Villa, despite only having mobile homes, has a surprising diversity of footprints. Indeed, with narrow streets and small bock size Santiago Villa has high potential for walkability. Unfortunately in North Bayshore there is not a lot to walk to yet. Although they North Bayshore Master Plan looks good, so that may change in the next decade or so.