Analysis of VTA Ridership: Walkability, Density and Frequency
Variables
Which variable best explains ridership: Walkability, Density or Frequency?
Walkability
Some frame local transit (buses and light rail) as a “pedestrian accelerator”. The idea is that transit is useful only in places that are already walkable. If this is correct we would expect high ridership in more walkable places.
Density
Areas with higher population density should have higher ridership. On more than one occasion I have been told that we cannot have good transit in Mountain View until we build more dense housing. If this is true we would expect housing density to be correlated with ridership.
Frequency
More frequent service makes transit more convenient. If a route is frequent enough people won’t need to check timetables or plan the trip ahead of time.
Datasets
Stops, Routes and Frequency
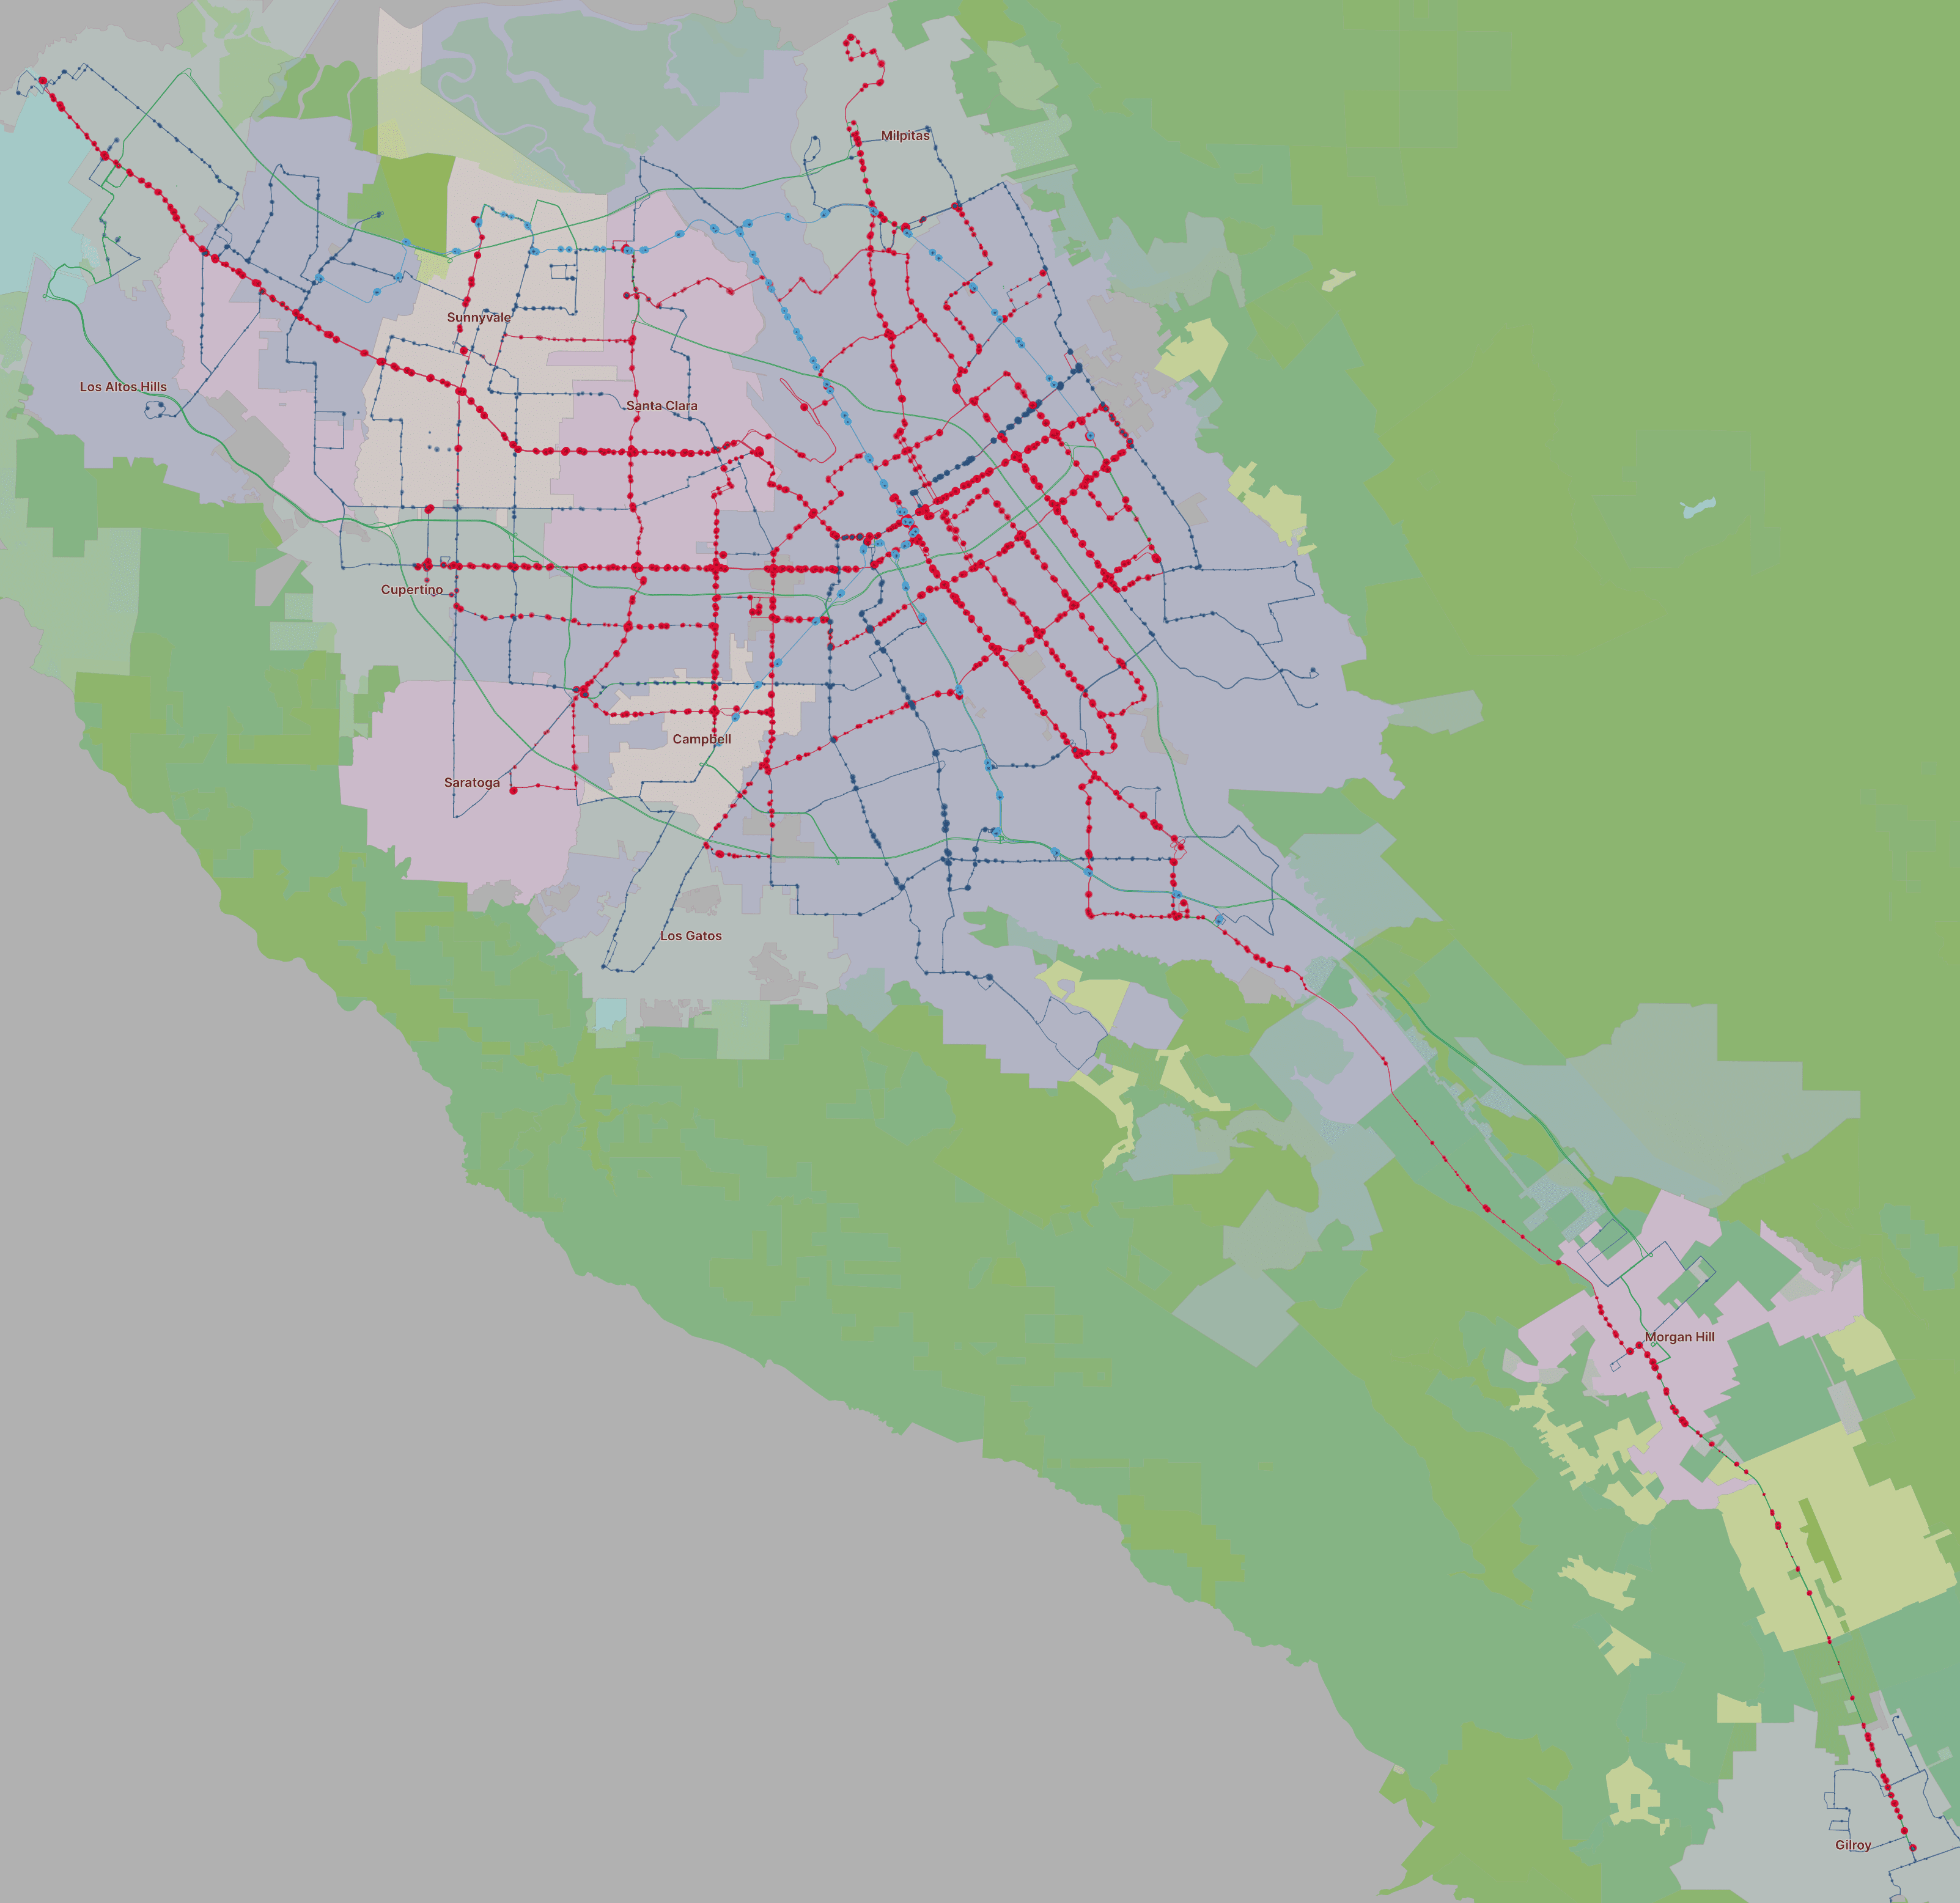
Stop and route data was pulled from the Santa Clara VTA Open Data portal. Frequency was taken from Routes January 2020 and stops were taken from Ridership by Stop February 2020
I wanted pre-pandemic ridership data, so I found 2018 data from the VTA github
Density
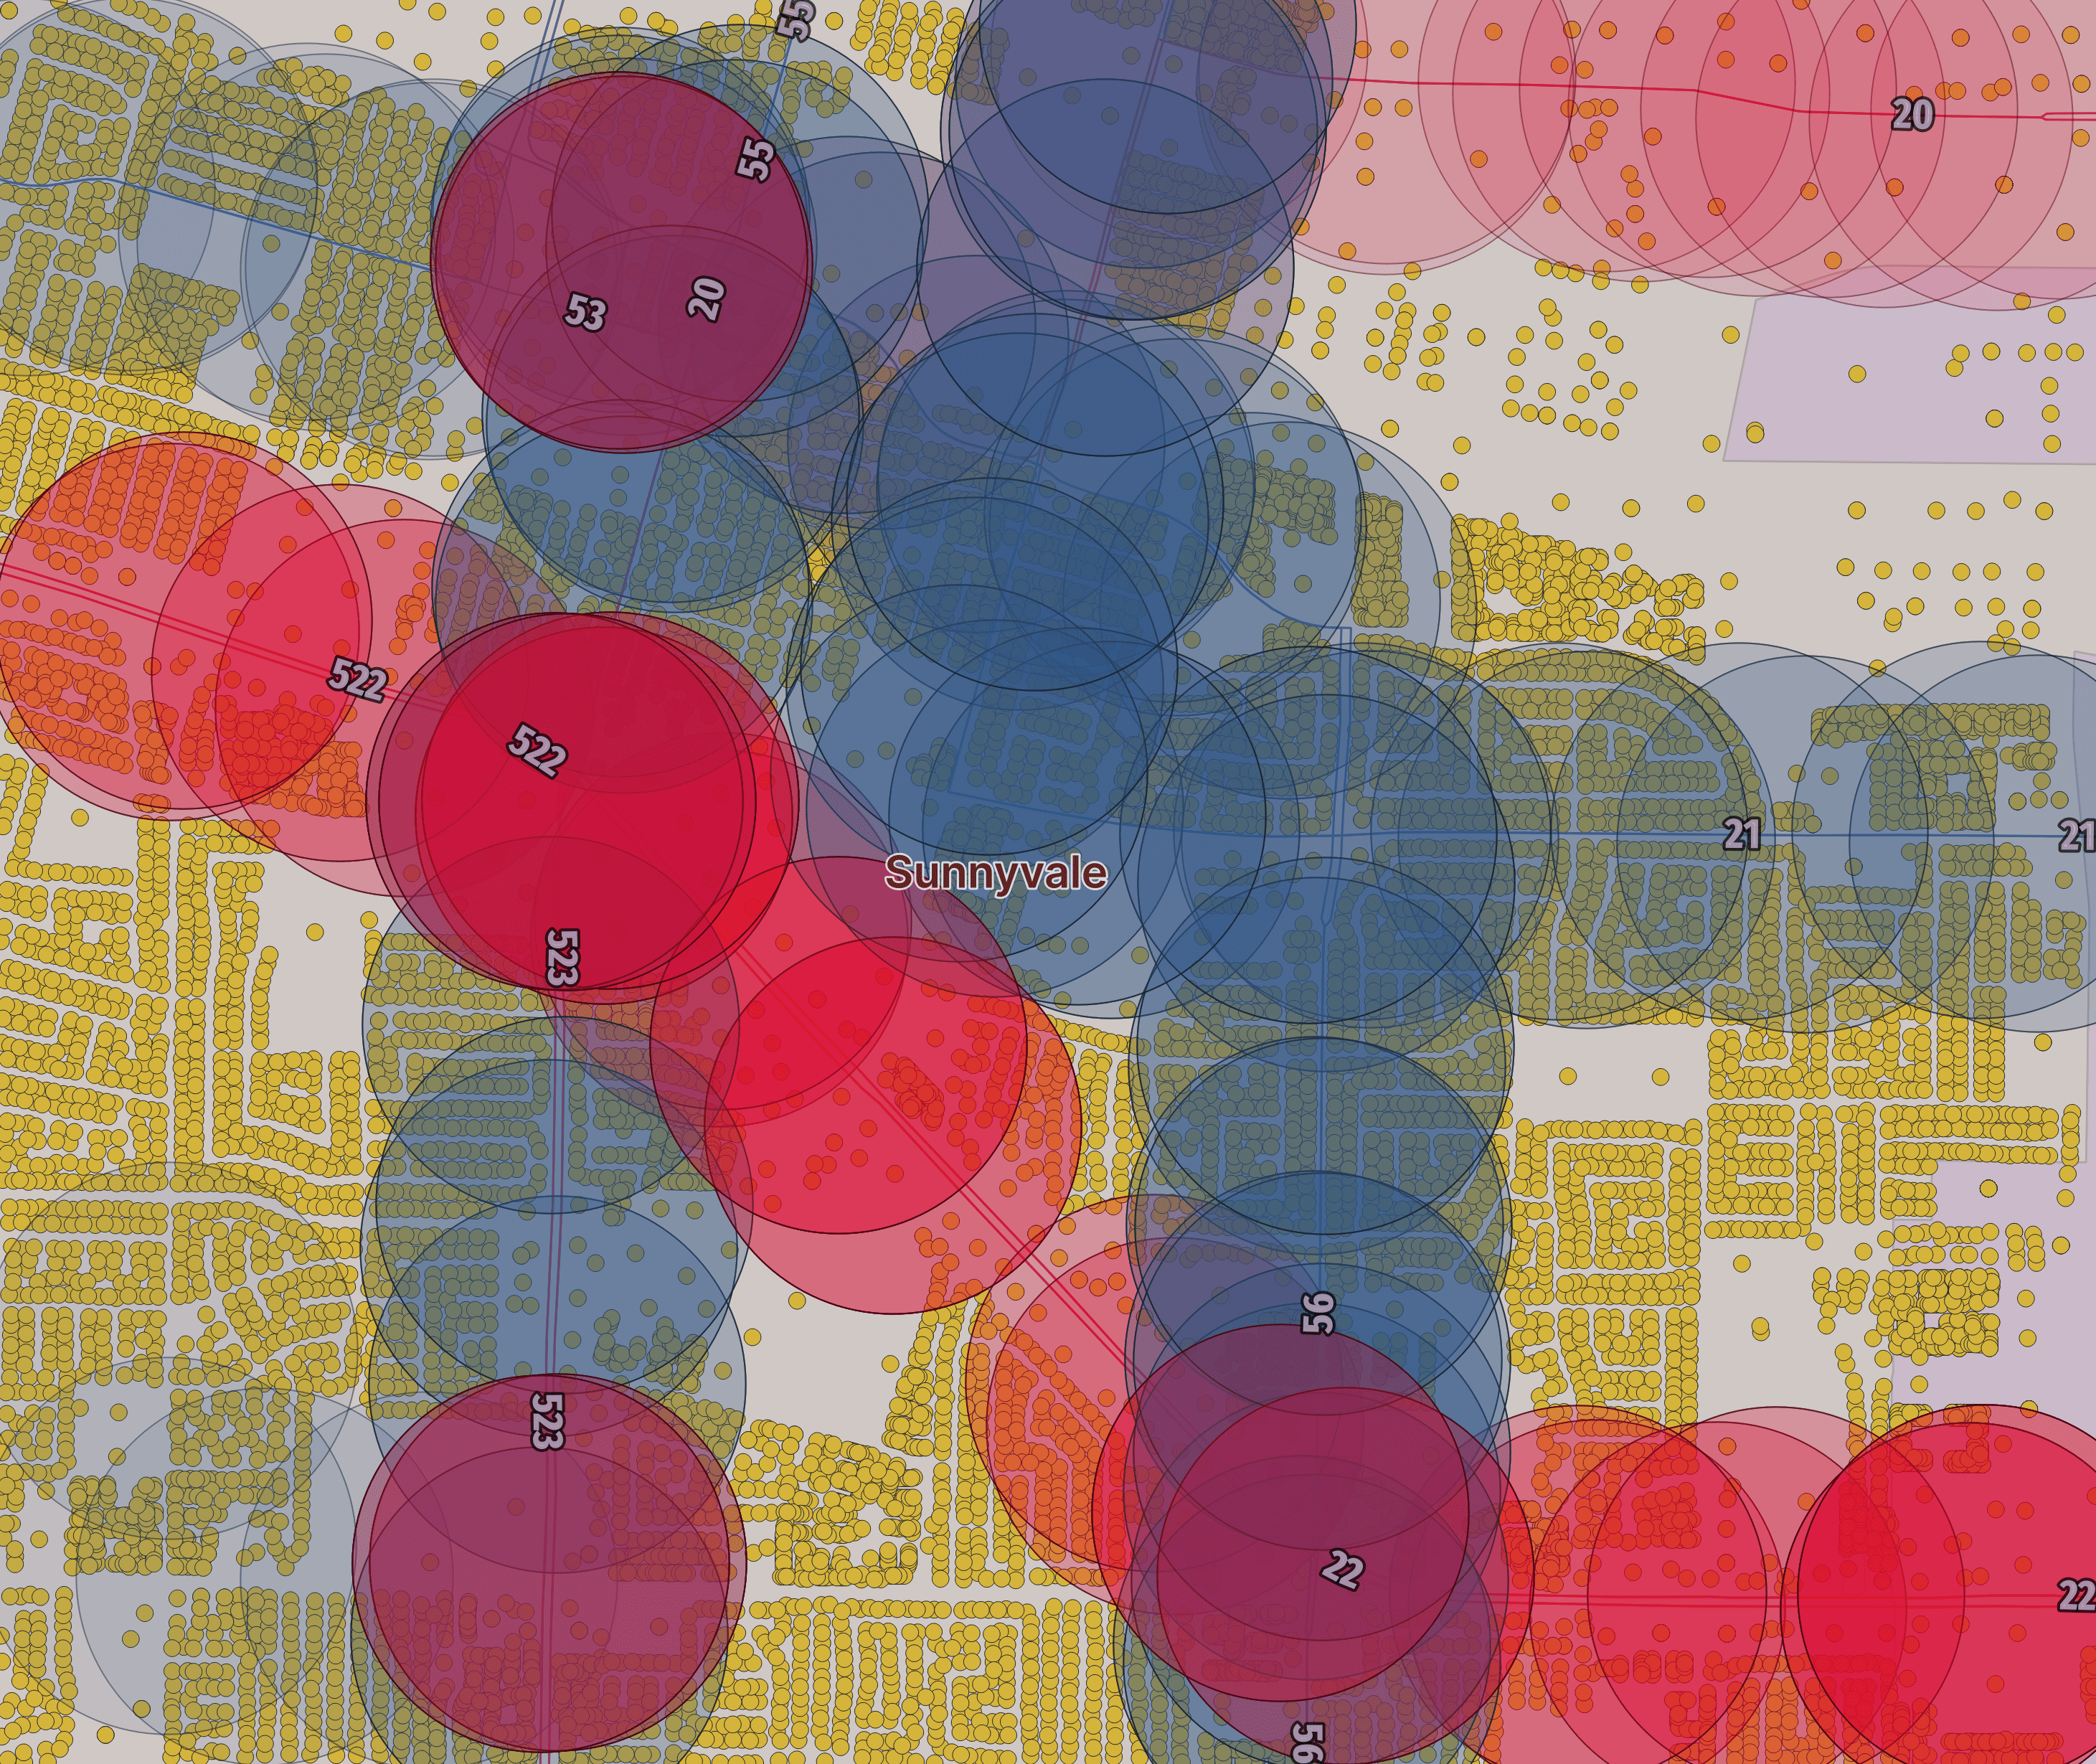
The total number of address points within a quarter mile of each stop was used to approximate population density. The data was taken from the Santa Clara County Open Data portal for 2019.
Walkability
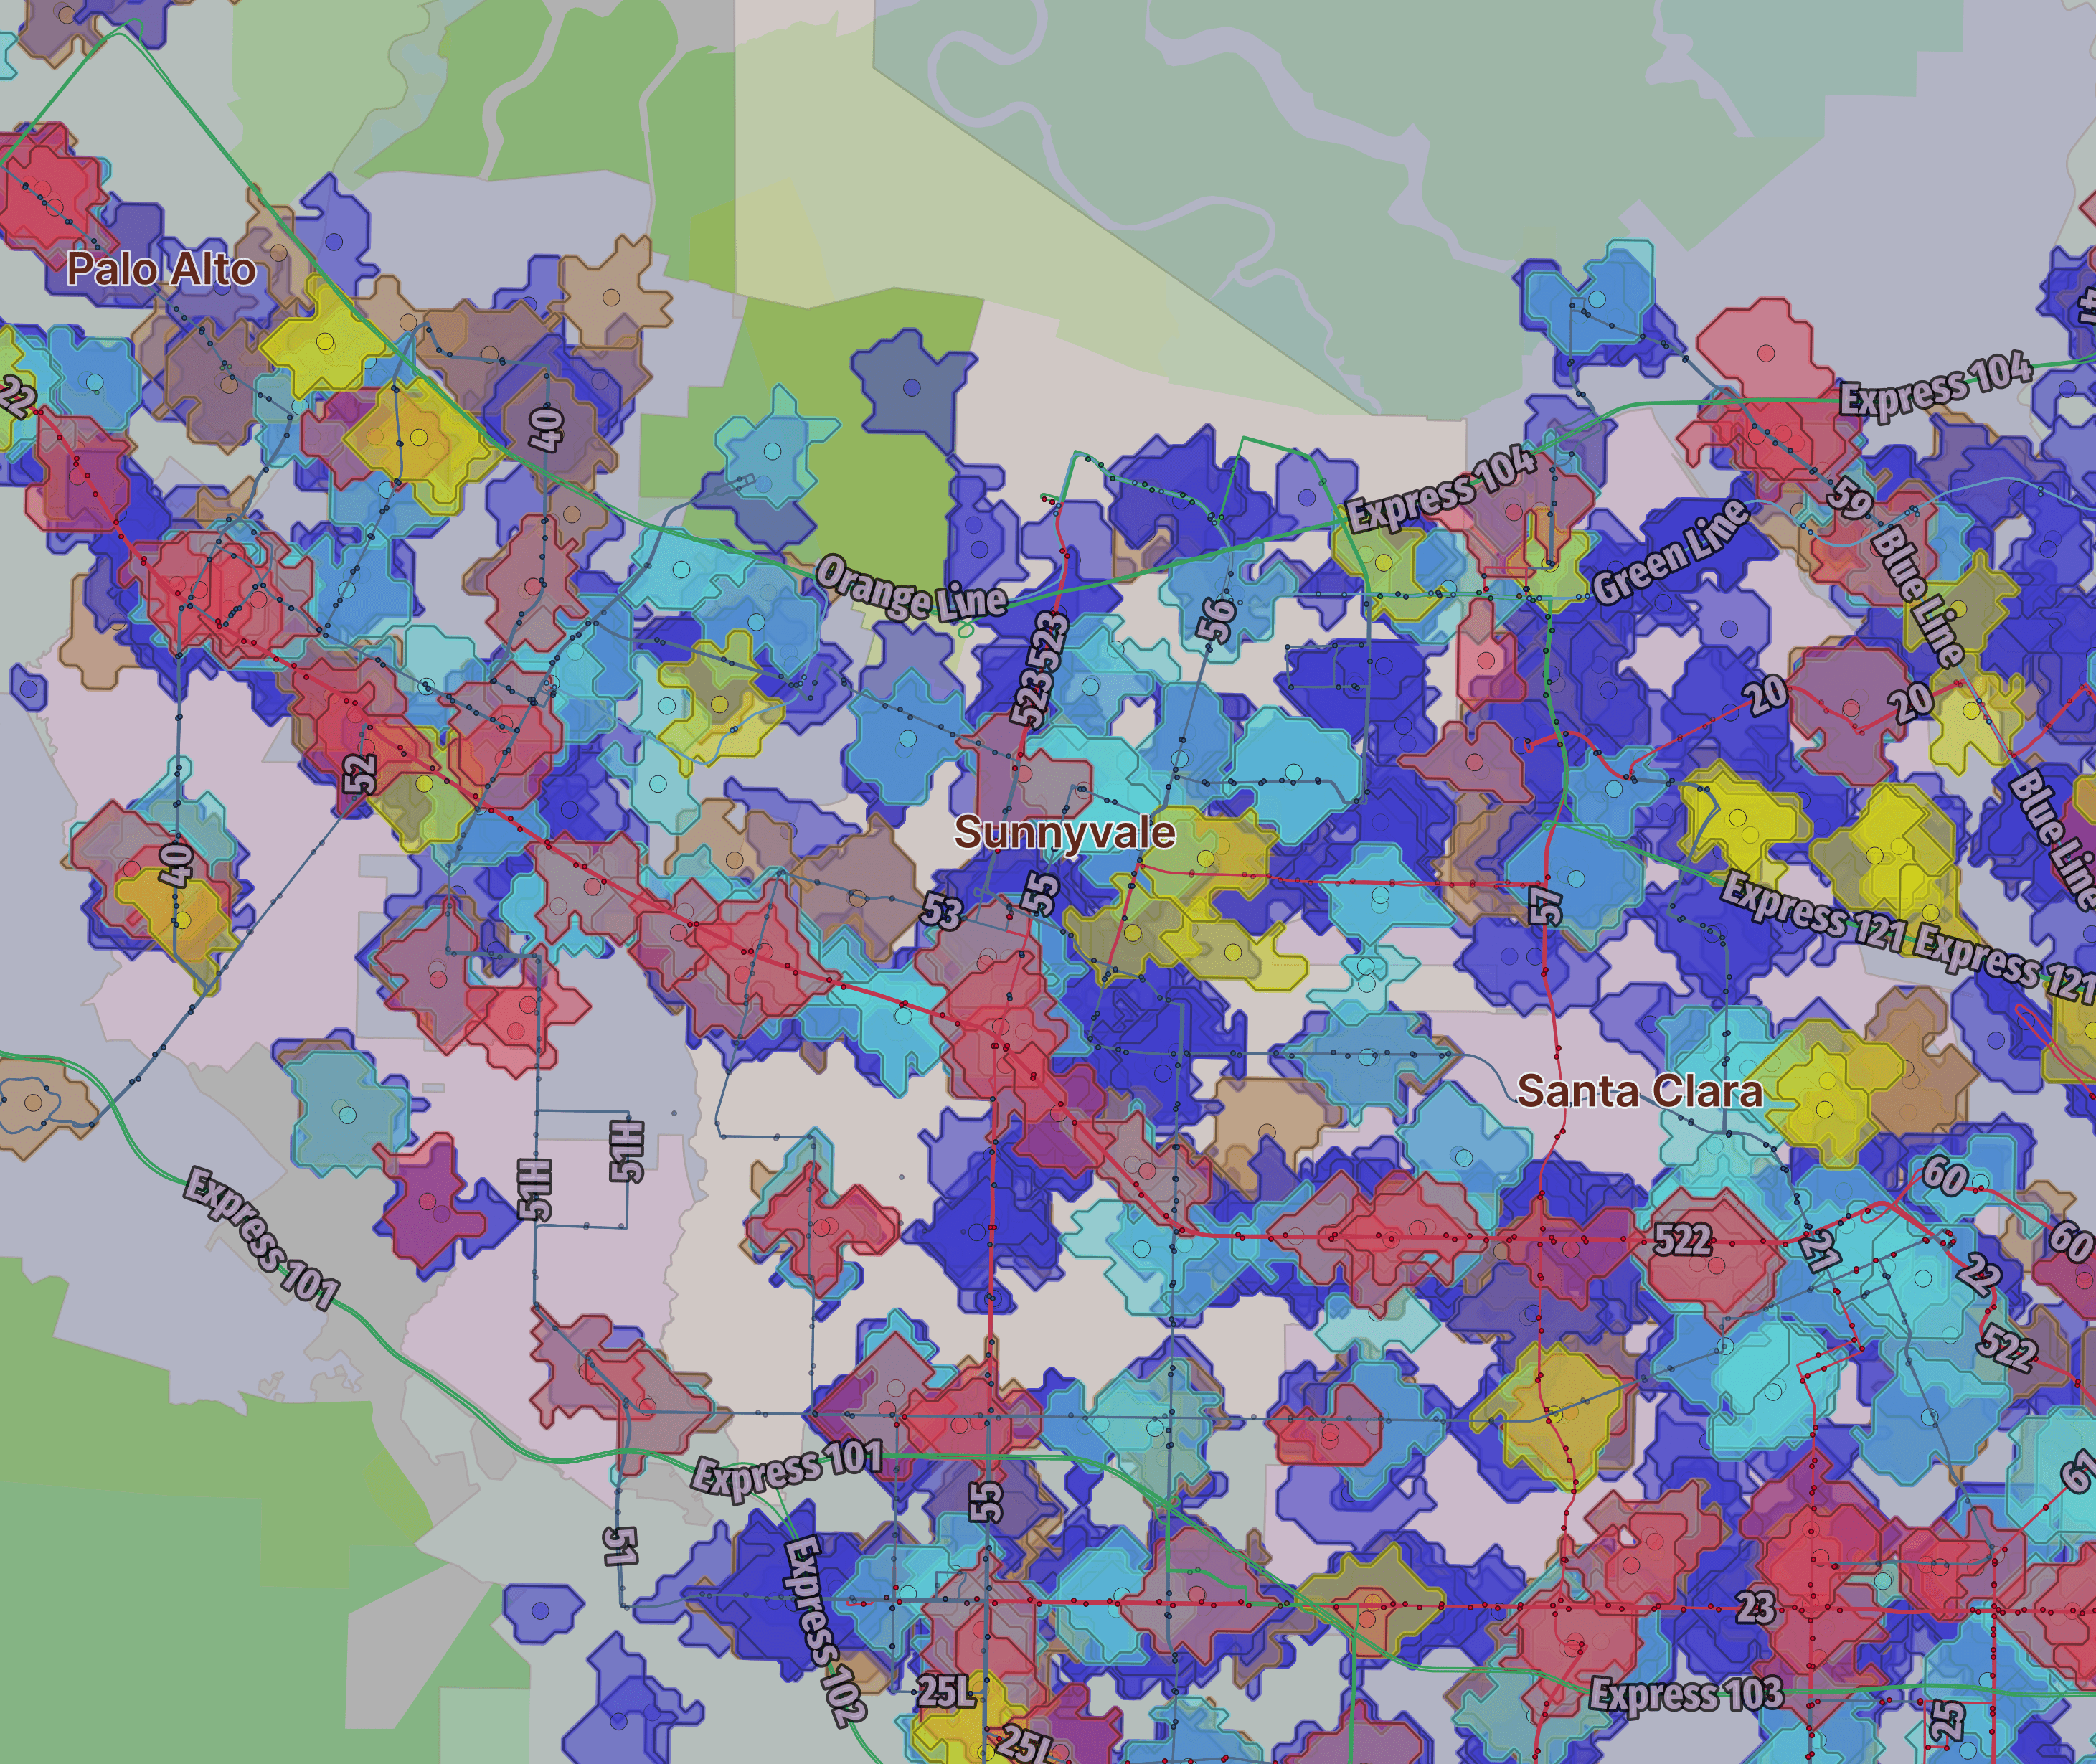
For walkability, data from AEI Housing Center’s Walkability Oriented Development tool was used.
This dataset includes polygons for pharmacies, coffee shops, restaurants, hardware stores and supermarkets. Each polygon is the area within a 10 minute walk of the business. Counting the polygons that intersect each bus stop gives and approximation of the walkability of that stop.
Analysis
Frequency
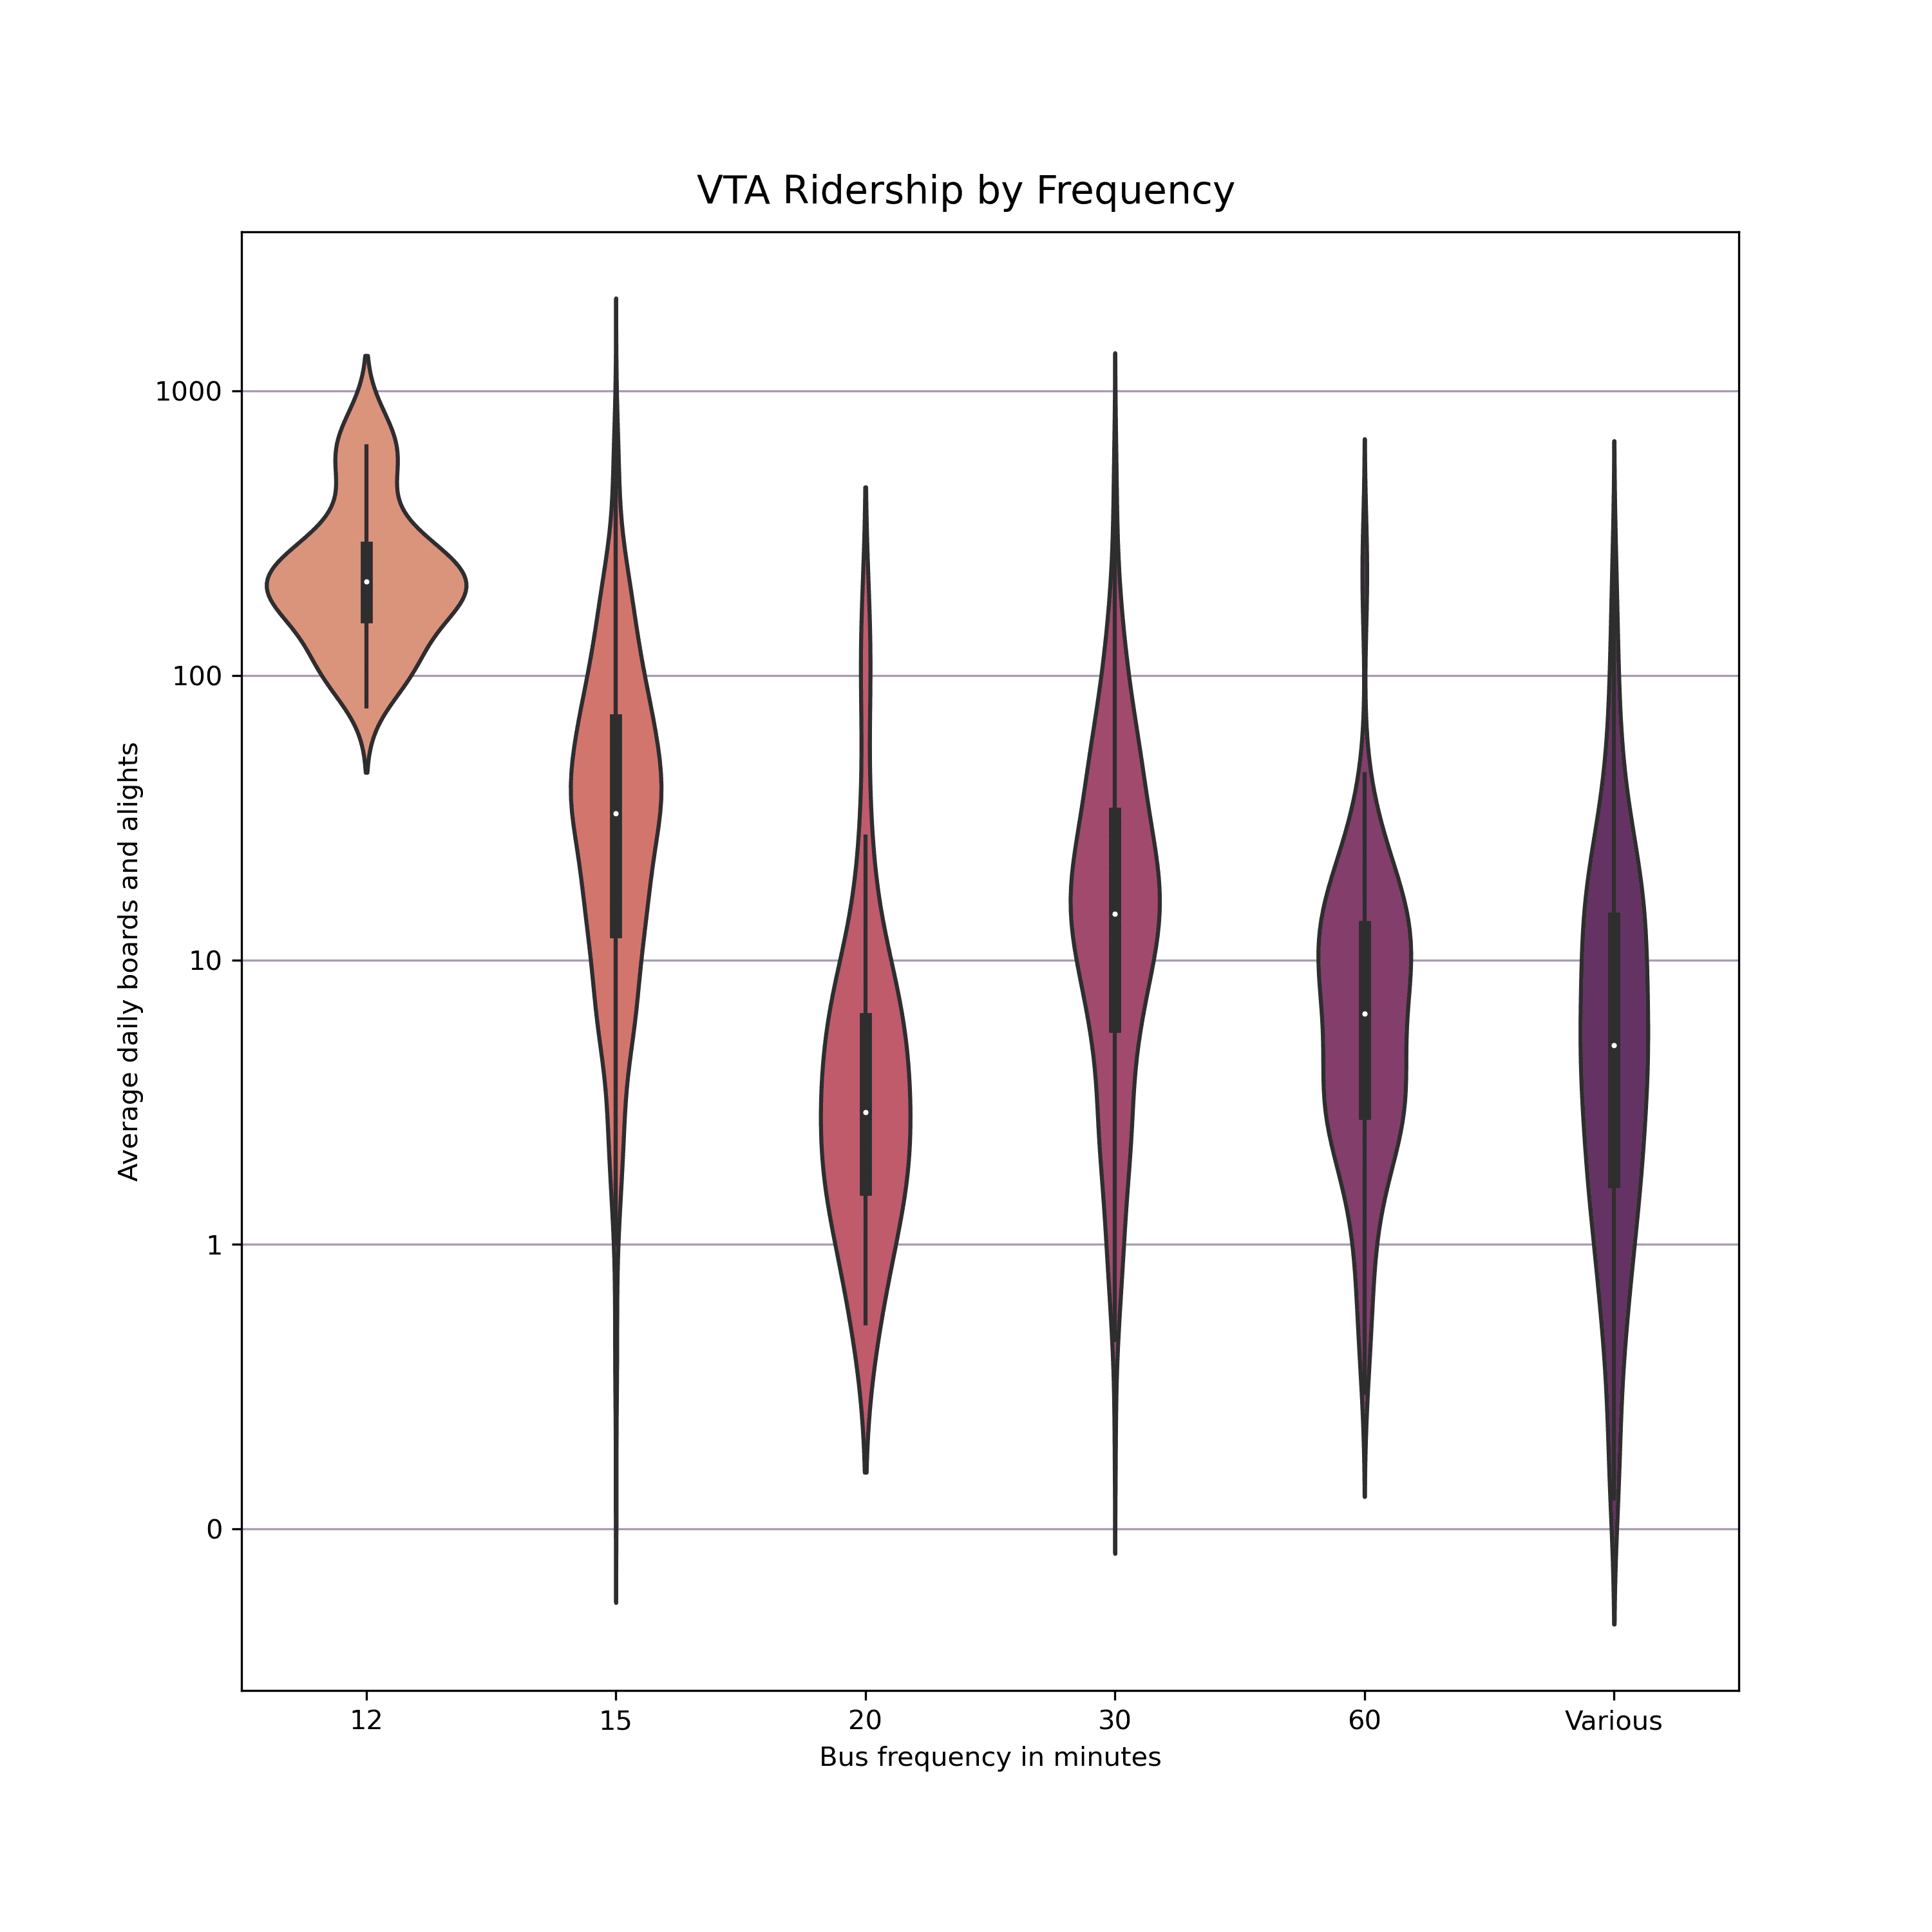
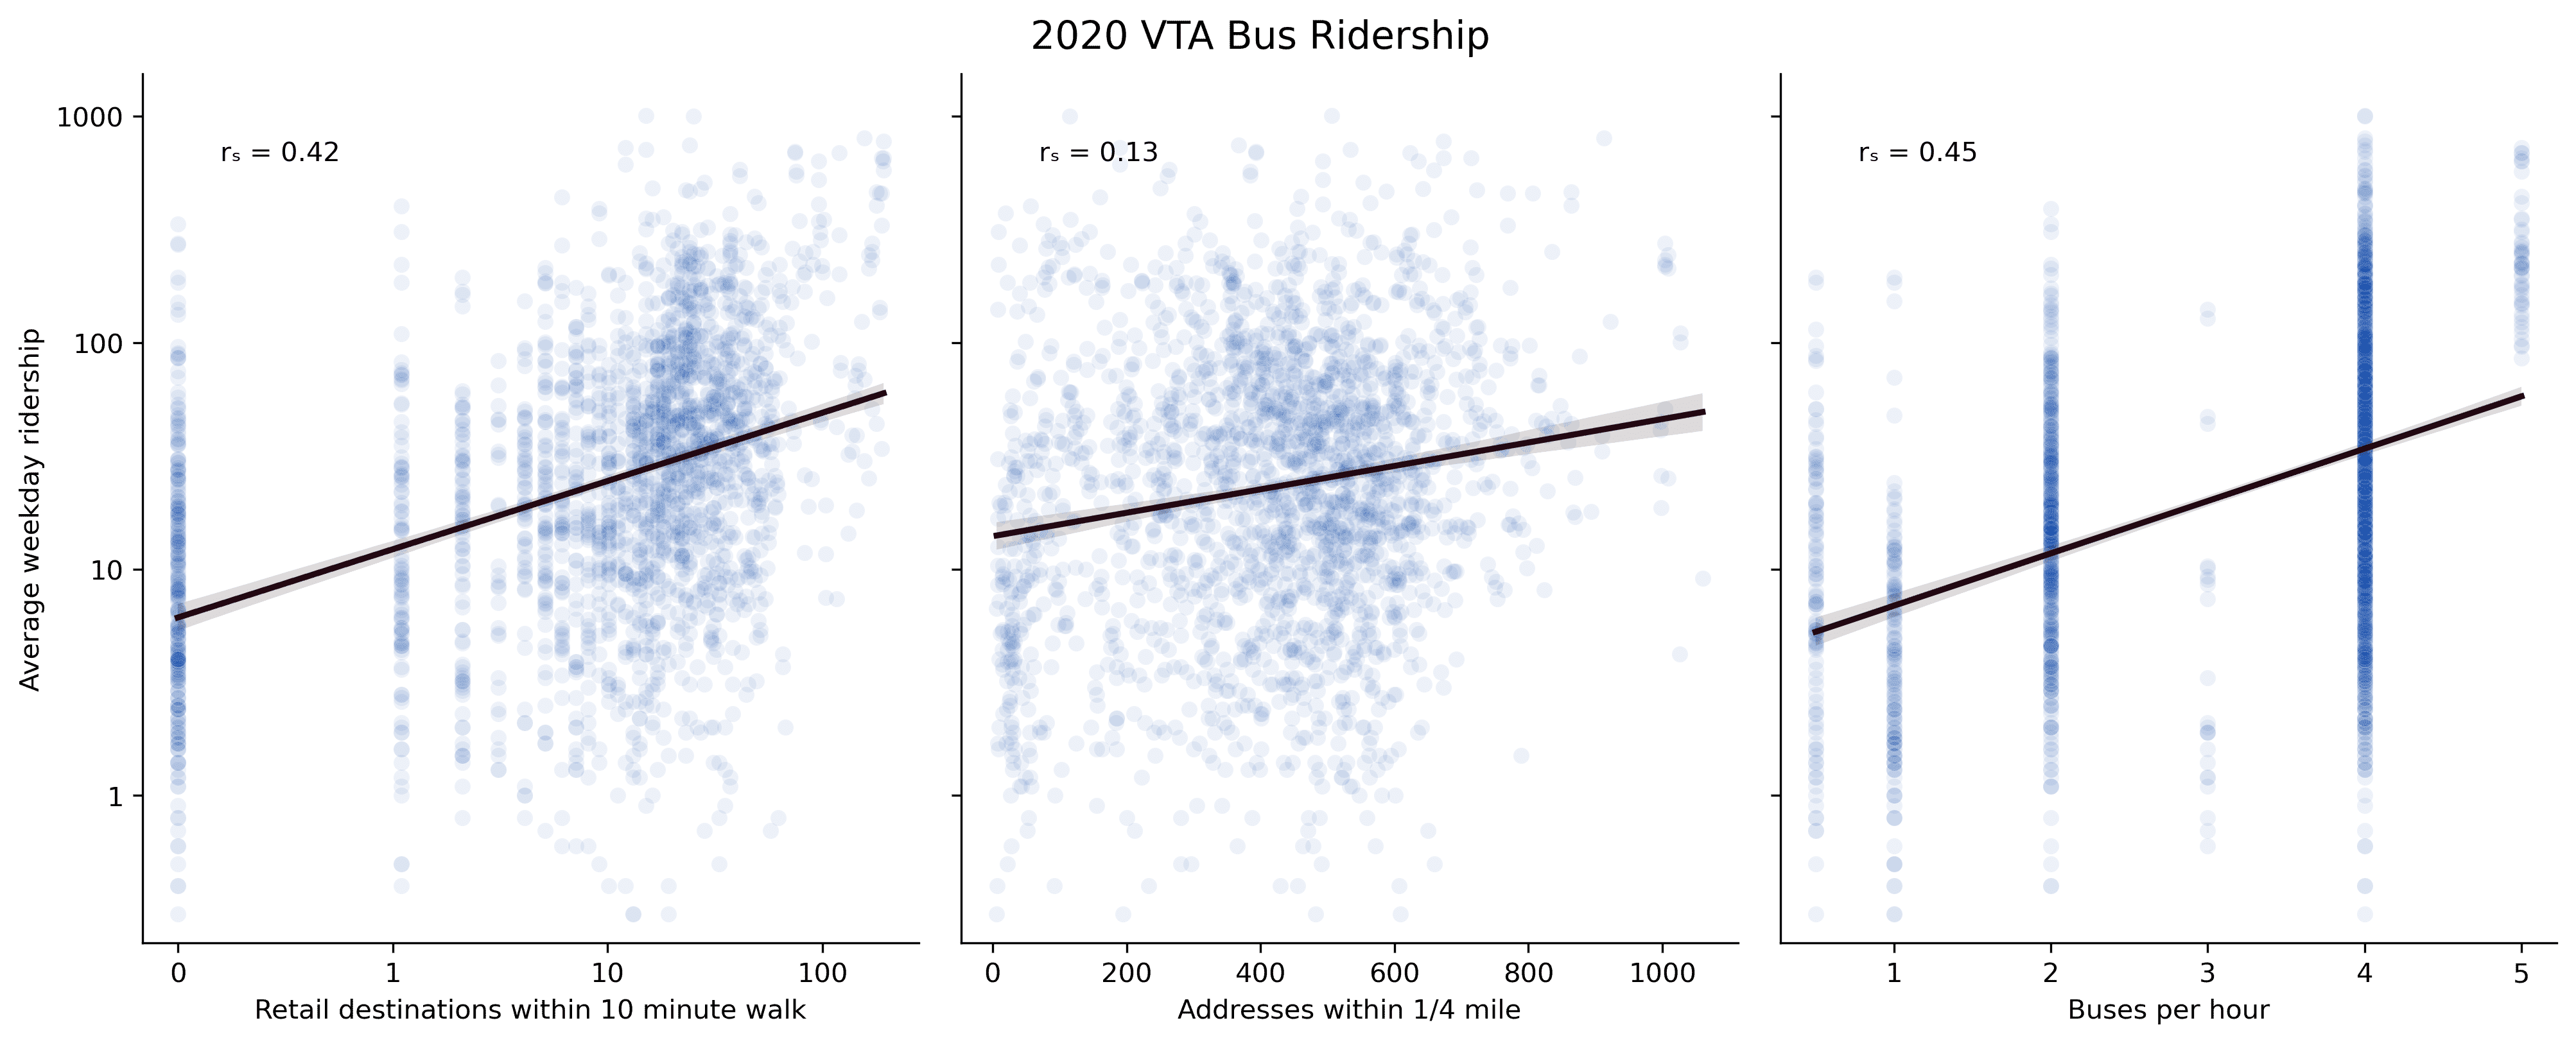
Unsurprisingly, more frequent service correlates with higher ridership. There is no way to know if higher frequency attracts more riders, or if lines with higher ridership are more likely to be assigned more frequent services.
Spearman’s ρ = 0.46 for the correlation of frequency and ridership. This metric can serve as a positive control for density and walkability.
Density and Walkability
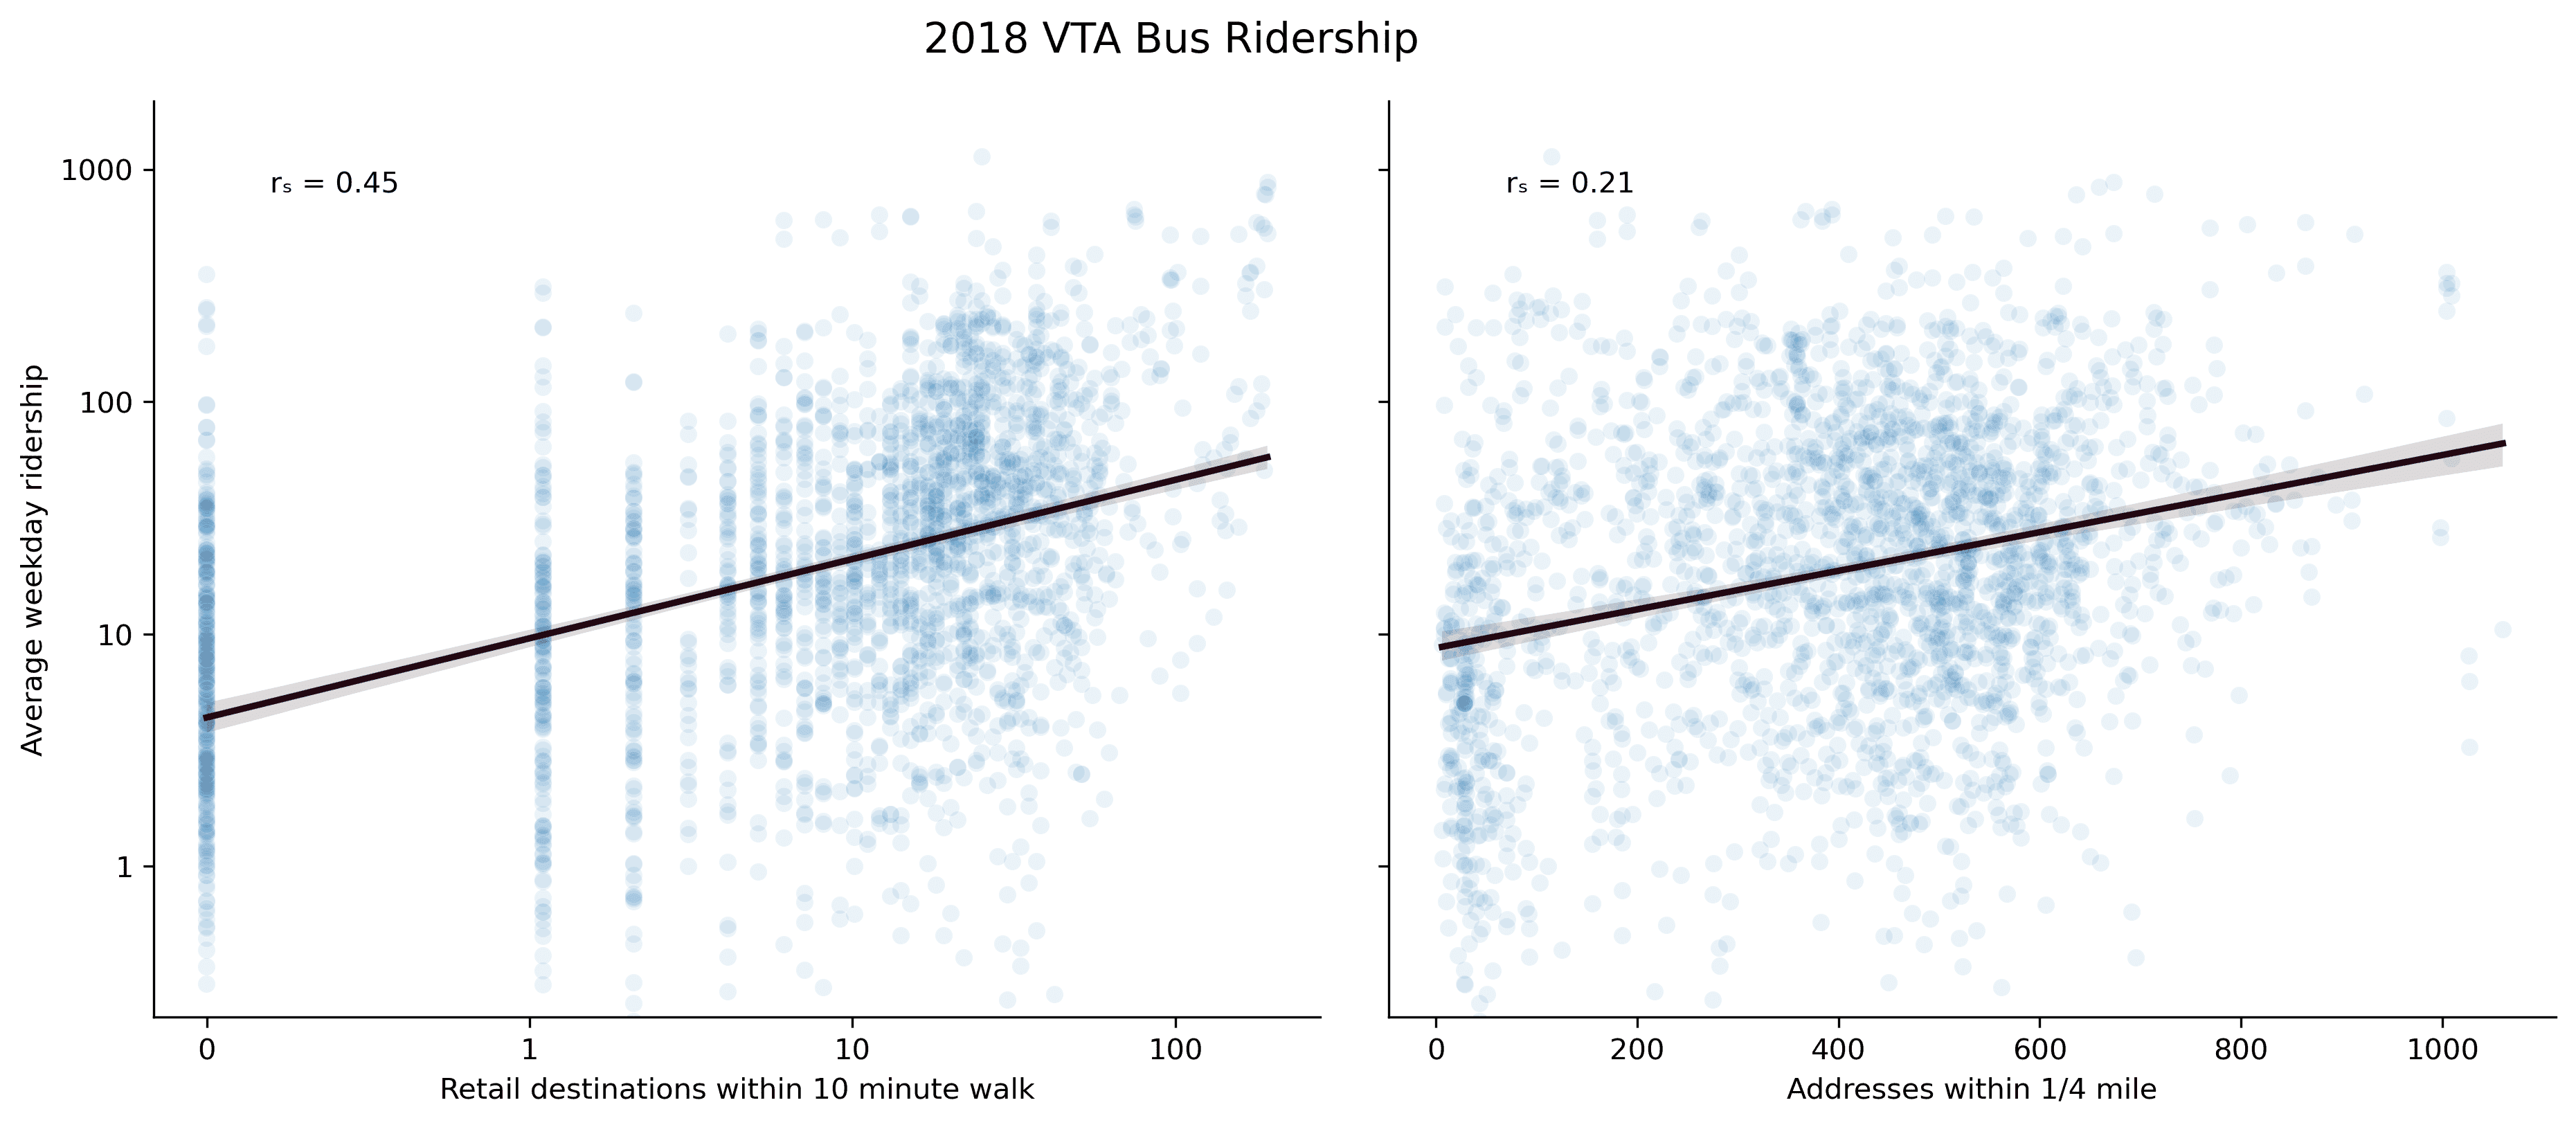
The number of walkable destinations had higher correlation with ridership than density.
Conclusion
This analysis indicates that population density, often cited as a prerequisite for good transit, does not have as strong as expected effect on ridership. Much more important is the walkability near transit stops. Building mixed-use walkable neighborhoods may increase traditional transit ridership, in addition to walking and biking.
Discussion
The lower correlation with density might be caused by the lack of variation in density. Densely populated areas in Santa Clara county have 5x the population of sparser areas, and most data points are clustered in a narrow range. Very few areas have enough concentrated density to have a measurable effect. In contrast, walkability spans two orders of magnitude.
Extra
As a sanity check I ran the analysis against the 2020 dataset, and the correlations were similar.
