When Mountain View Downzoned Downtown
Why does the zoning map of mountain view look so odd?
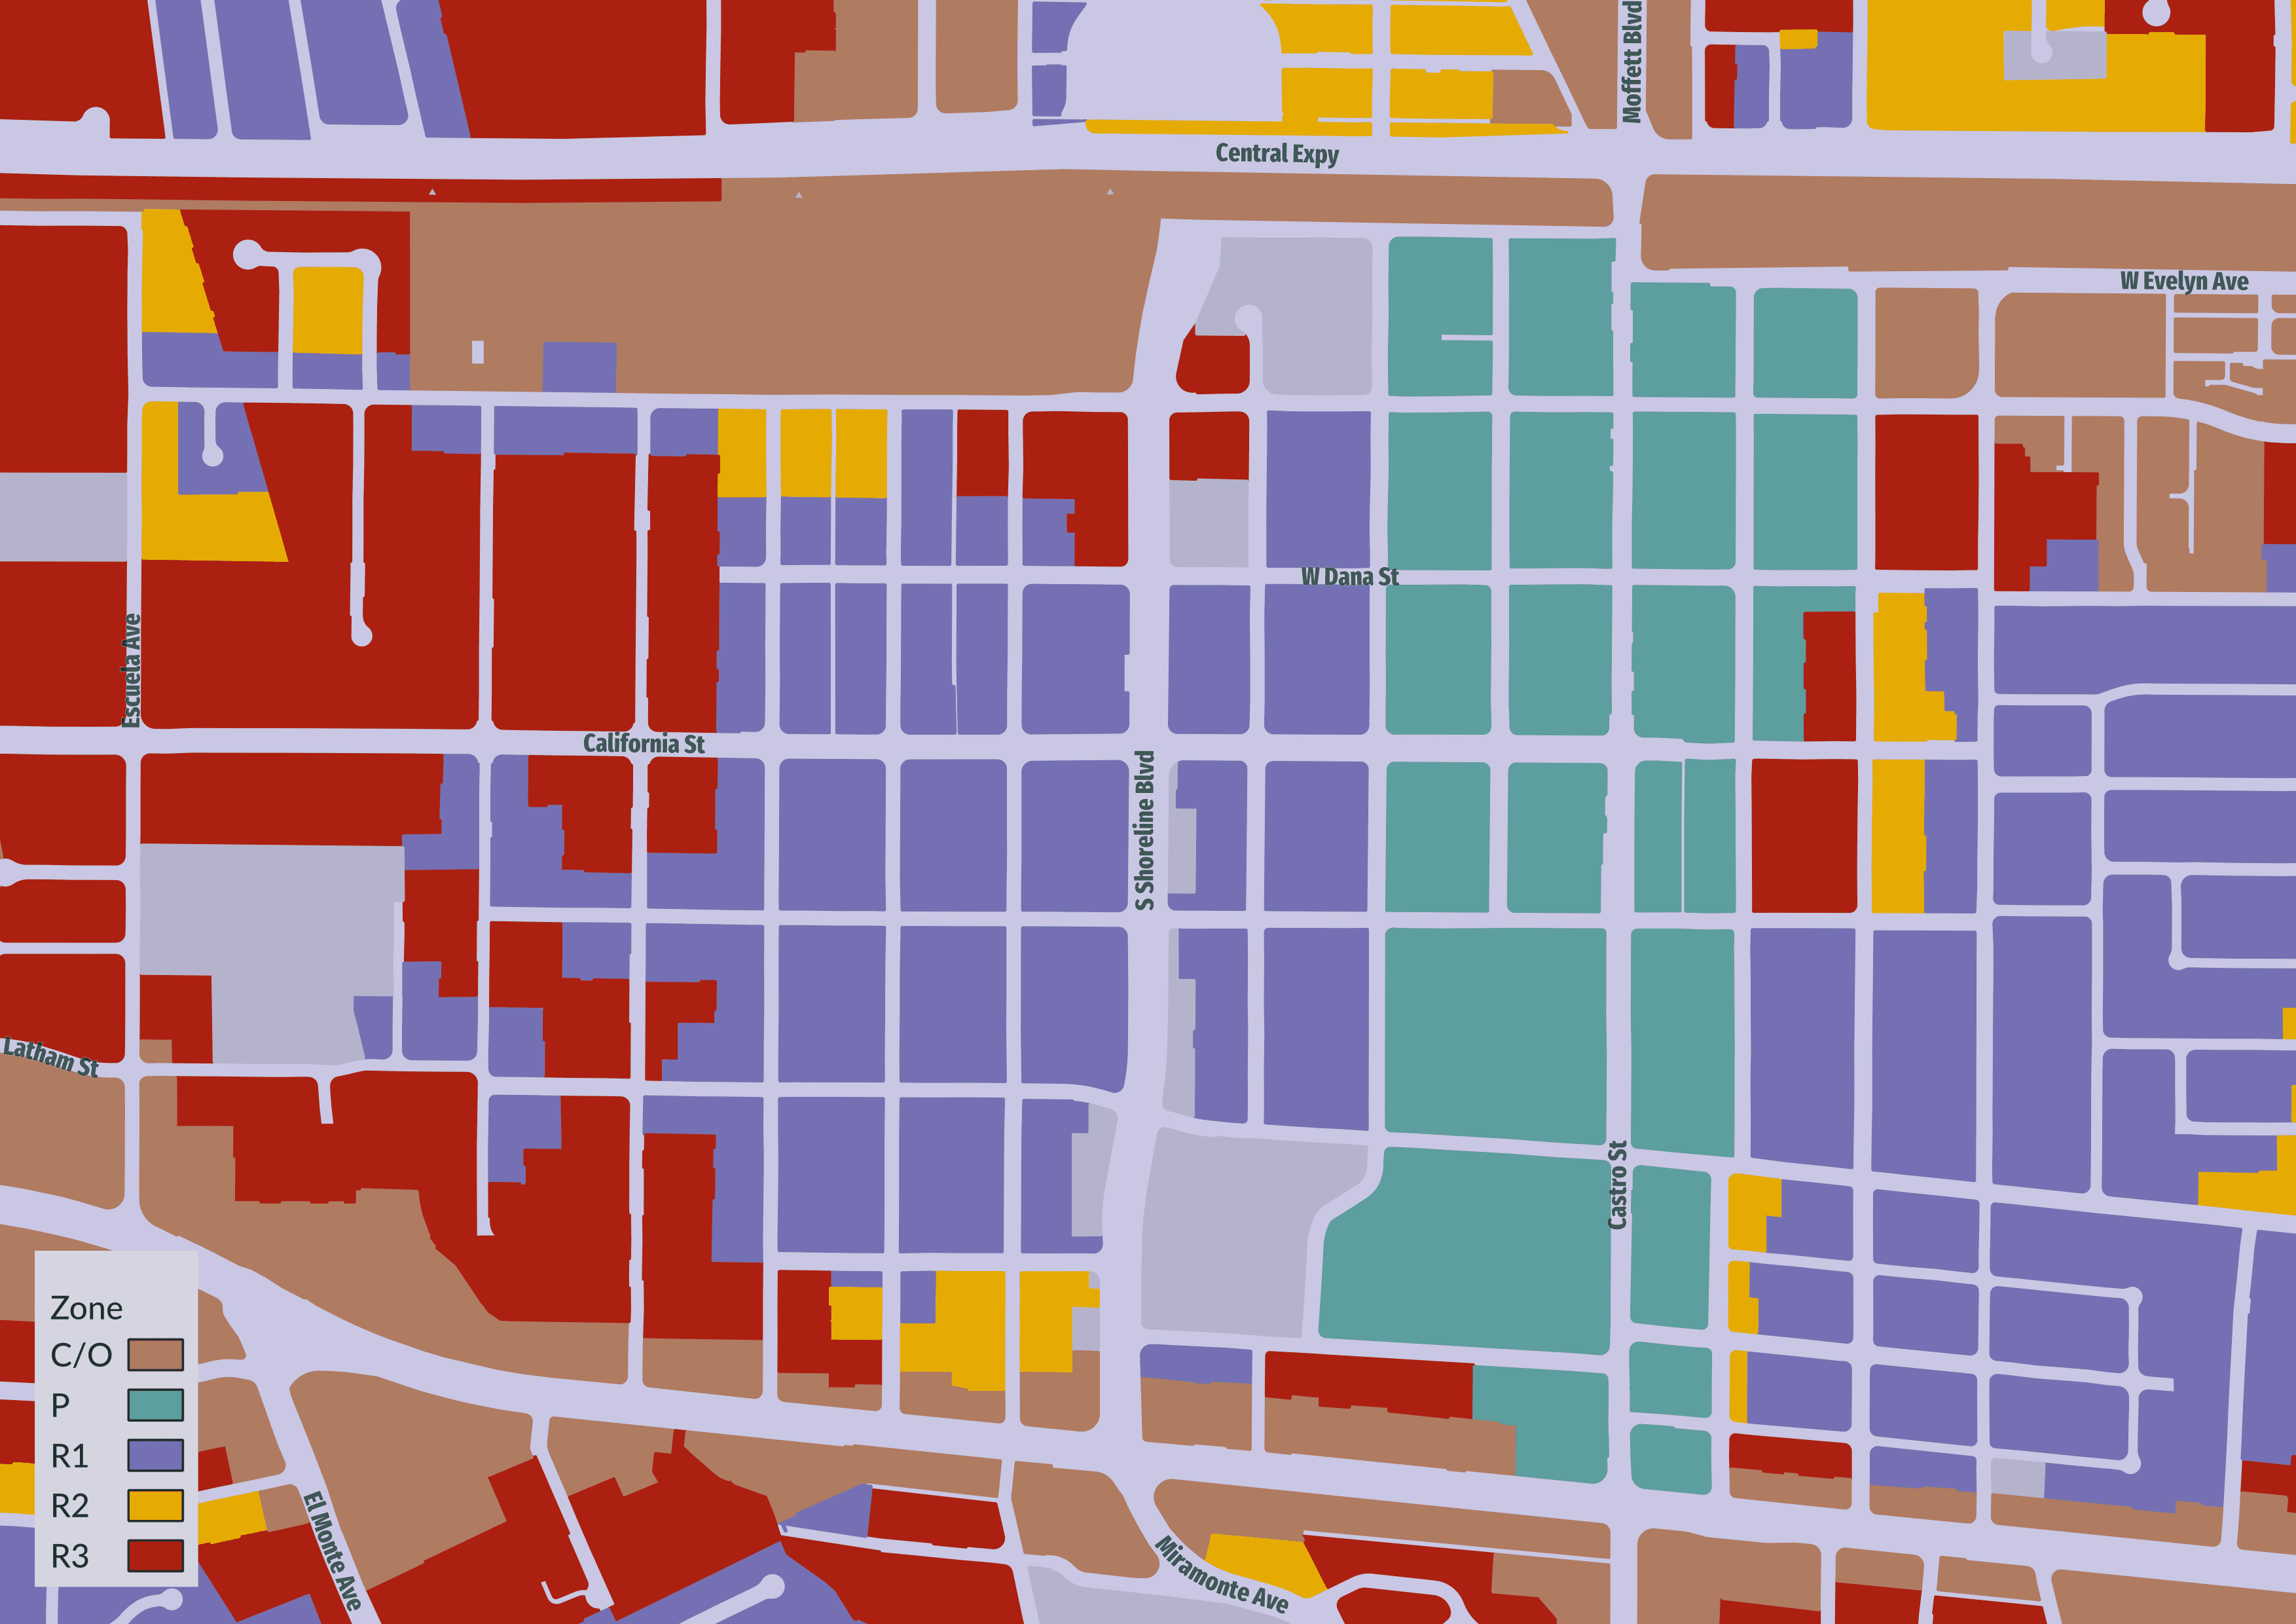
- C/O: Commercial or Office
- P: Downtown precise plan (mixed use)
- R1: Detached single family only, one home per lot
- R2: Duplexes allowed
- R3: Multifamily allowed
Between 1978 and 1980 the central neighborhoods of Mountain View were rezoned bit by bit. This was called the “central city rezoning”. There were 16 phases. I was able to find 12.1 They generally follow an east-west trend, so I am confident I have all the rezoning maps west of Castro.
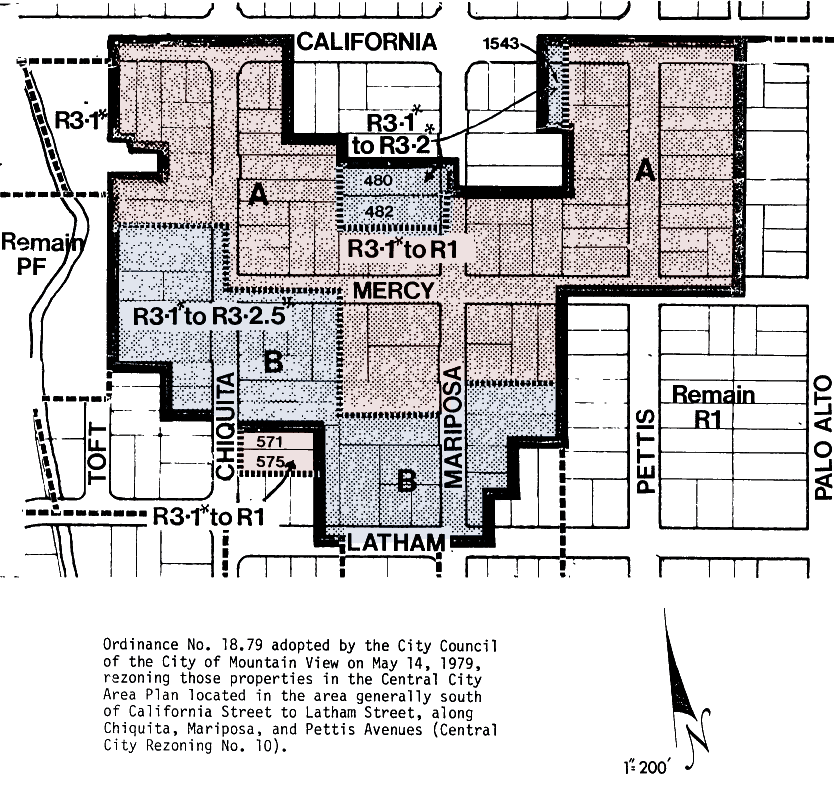
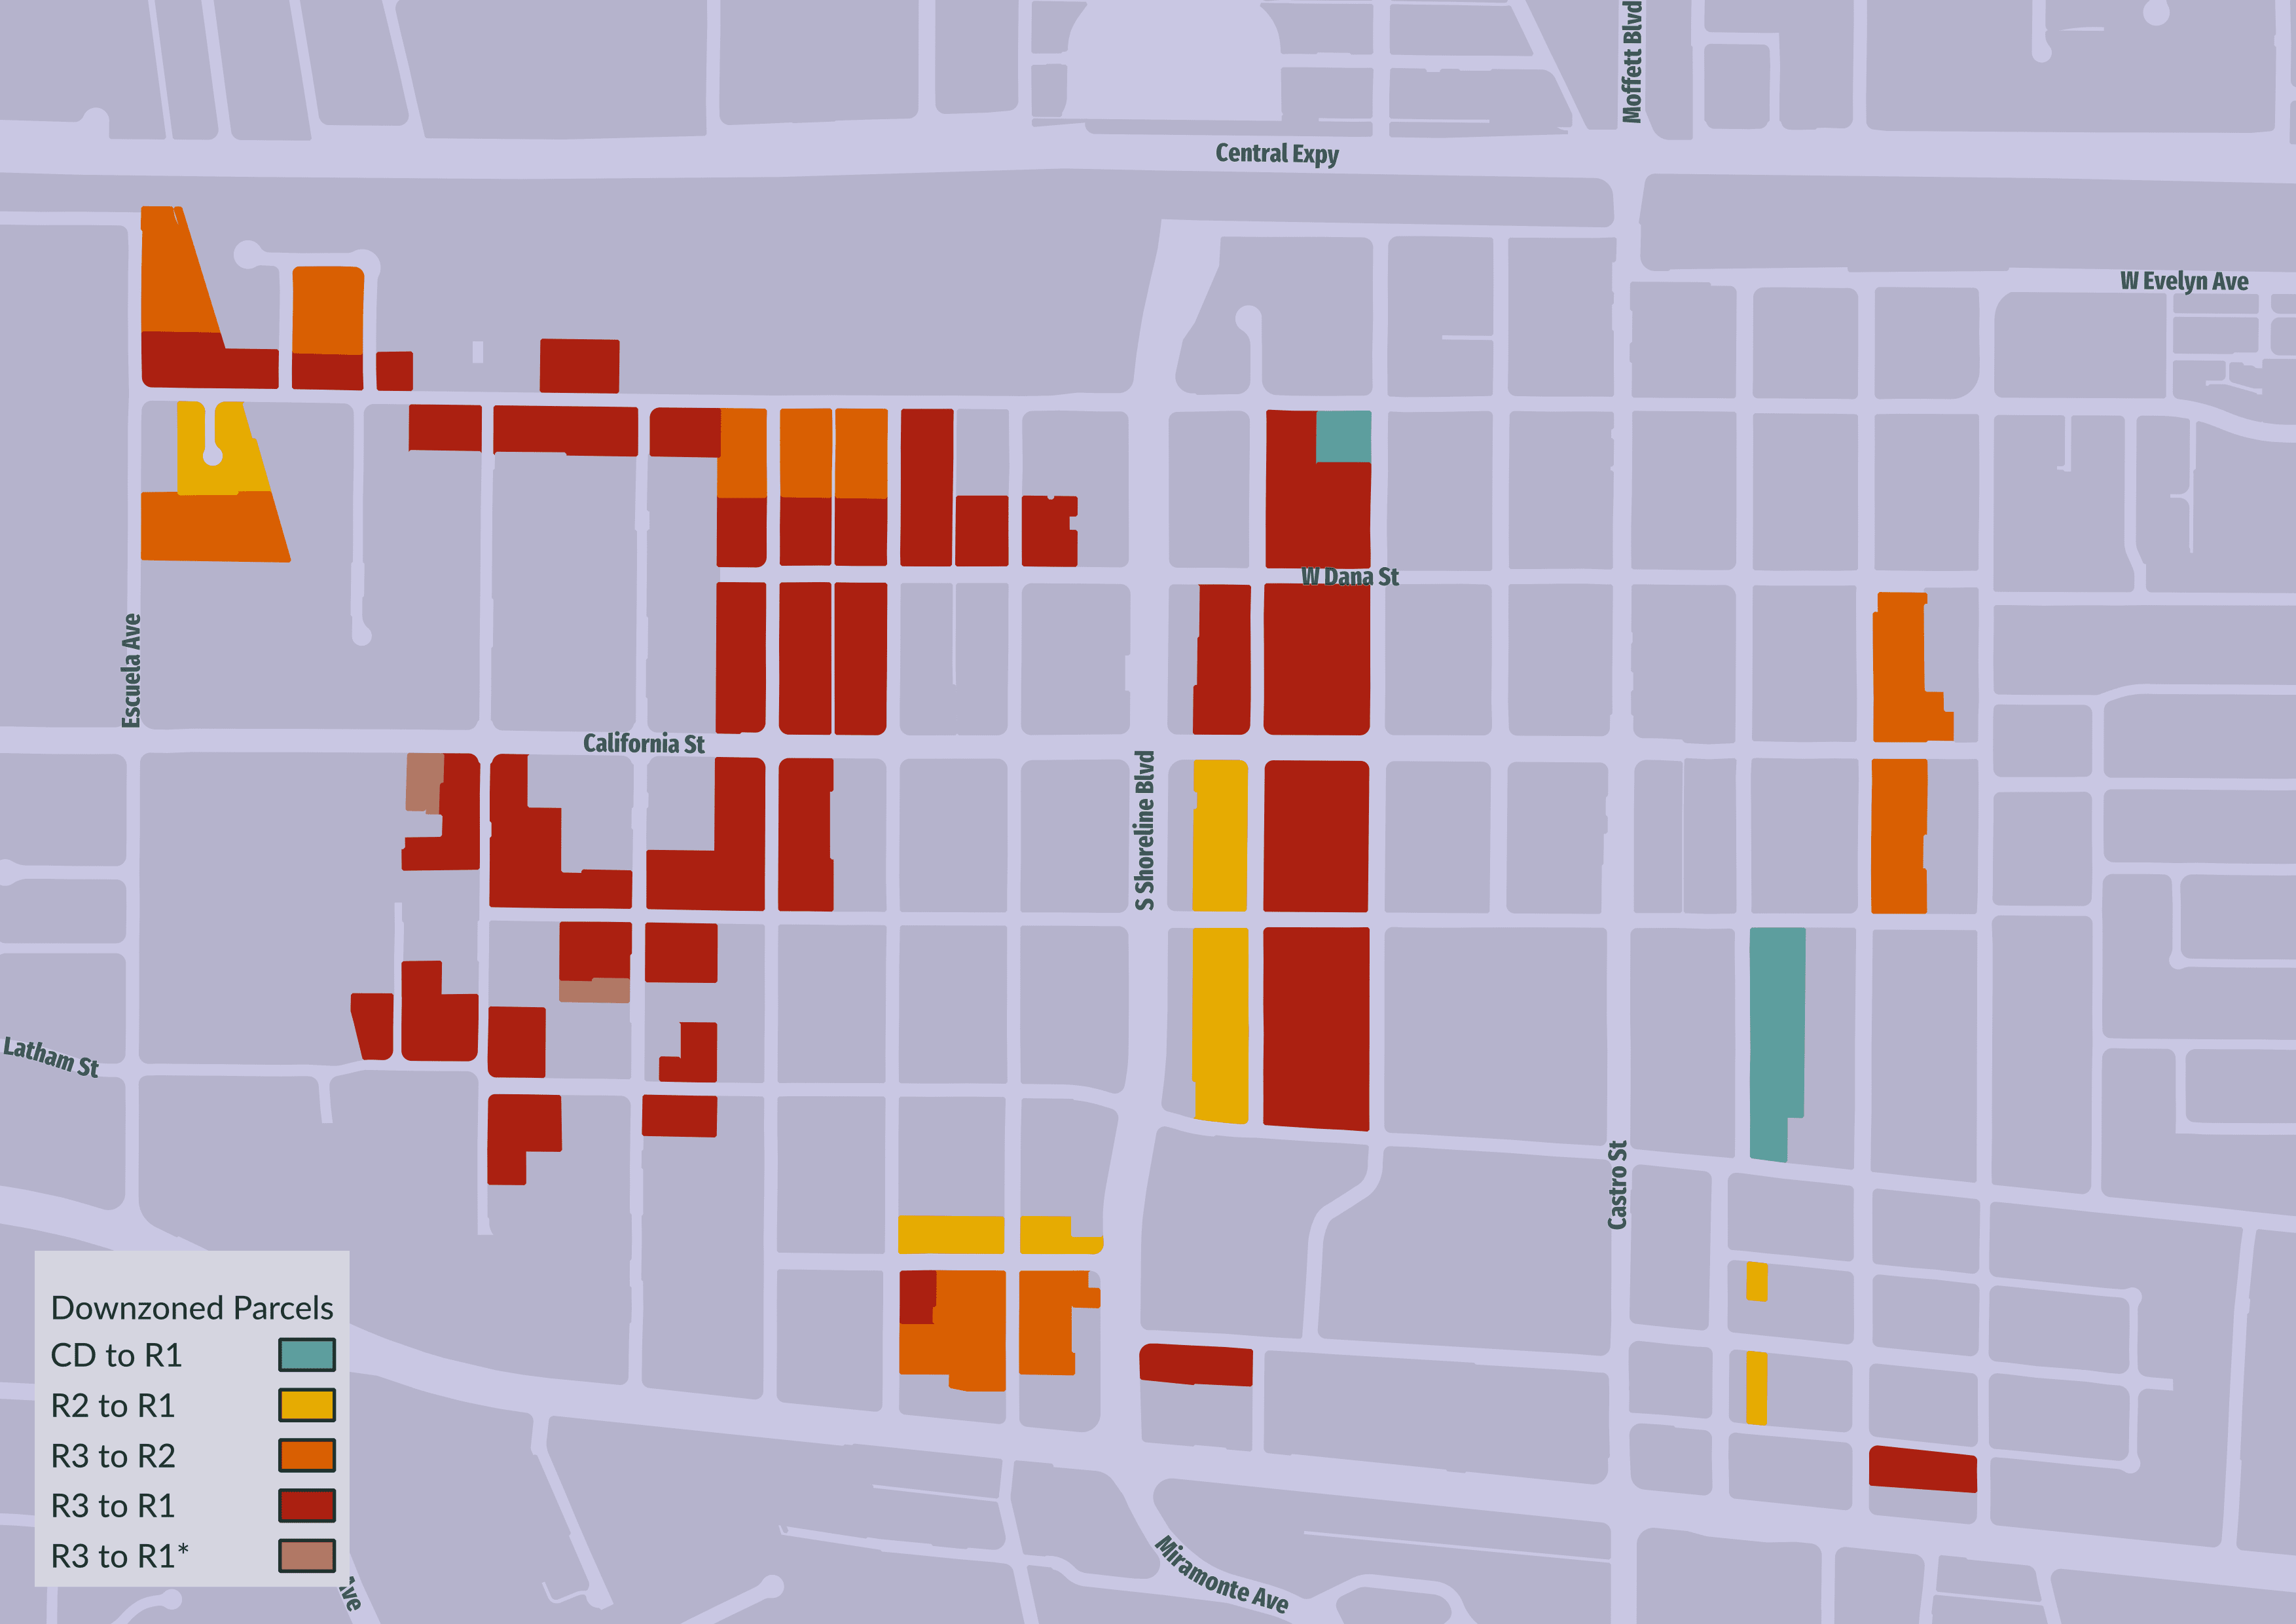
The re-zoning is mostly downzoning2. The upzoning that did occur was rezoning between R3 subclasses.3 I have mapped the changes.
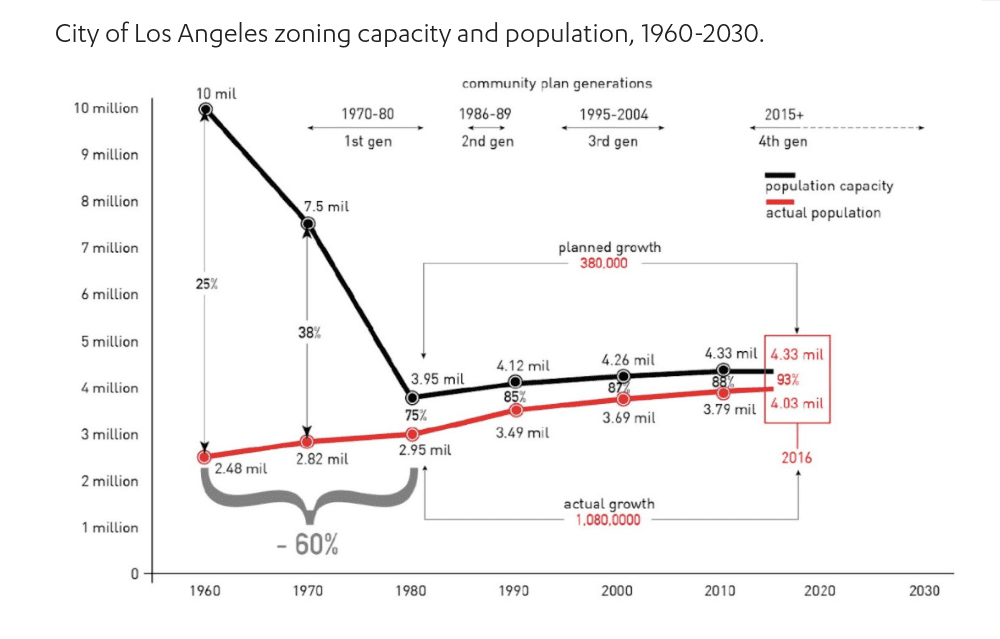
This rezoning was part of a nationwide trend of downzoning.
All the rezoning data for the western part, between Castro and Escuela, is available. This area has 195 acres zoned residential. Nearly one third - around 60 acres - were downzoned. Meanwhile the area zoned for single family homes more than doubled, from 35 acres in 1978 to 84 acres in 1980.
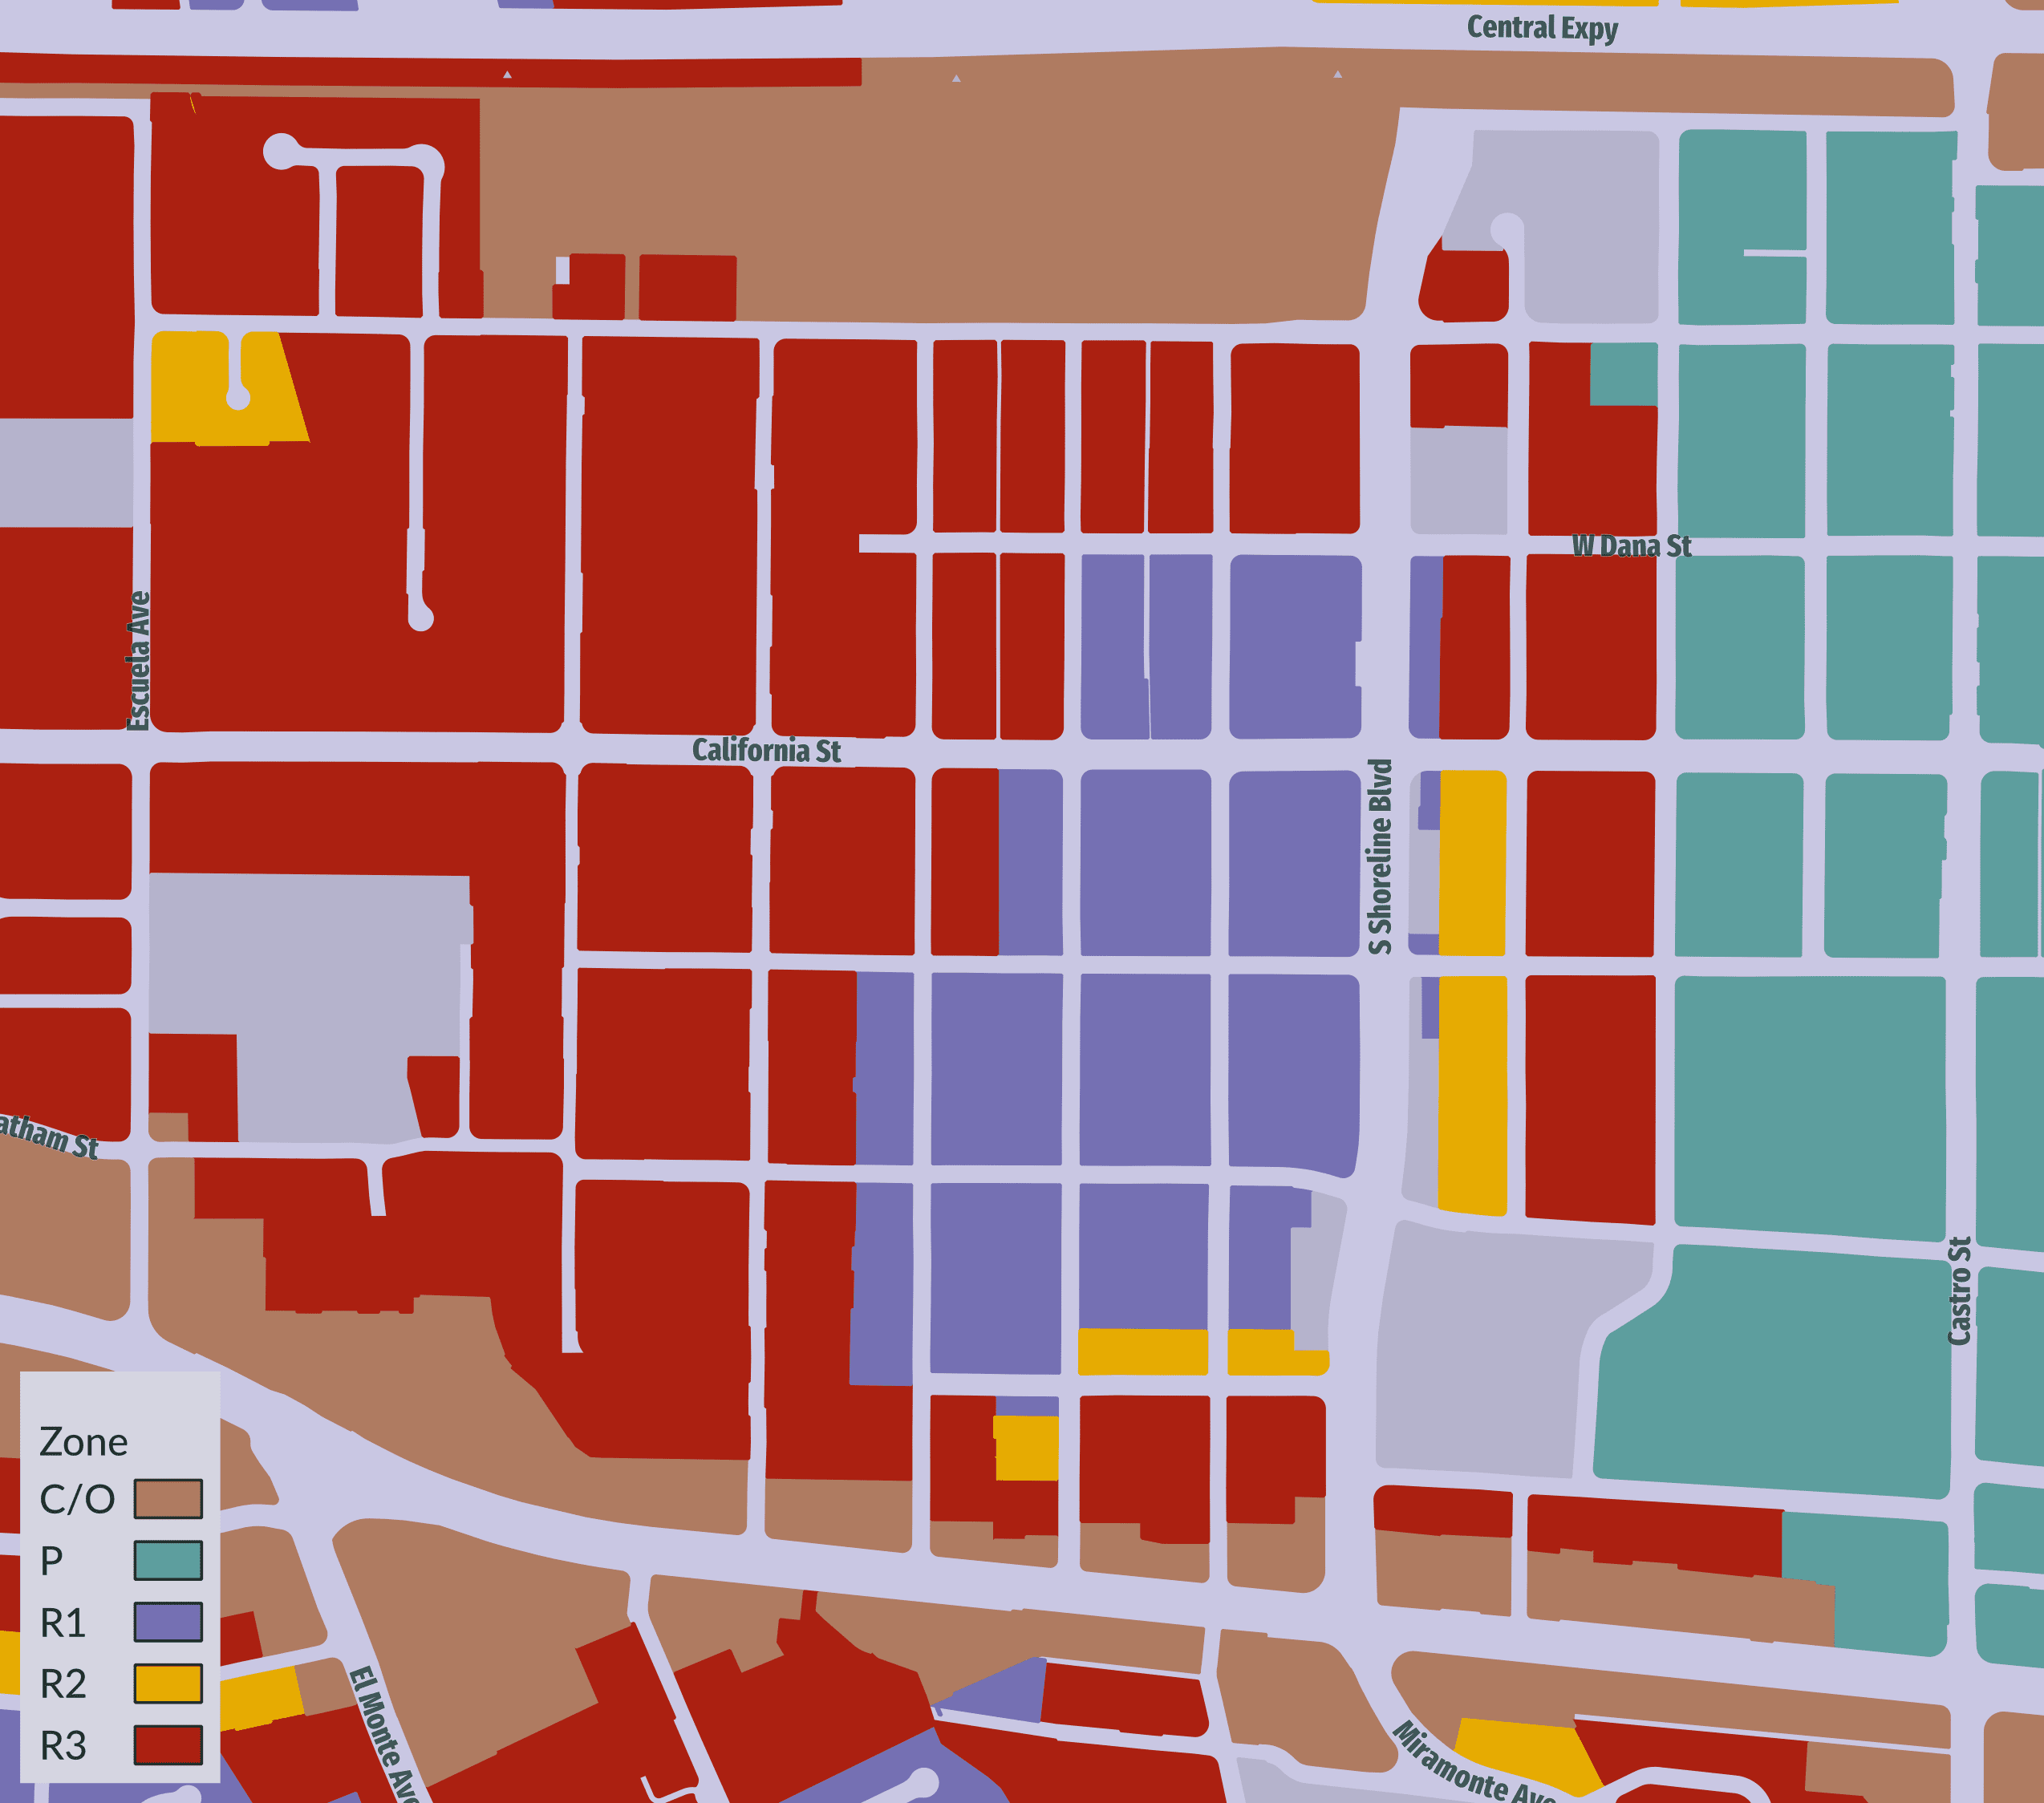
It is interesting how many single family homes were built in areas zoned R3.
I sometimes hear the argument that “American’s prefer single family homes”. There is truth to this, but it is not a good argument for keeping R1 zoning. Single family homes are built in all residential zones. Our laws only restrict multifamily.
Footnotes
-
Most records from before 1979 are missing. I know there are 16 because the later ordinances were numbered But erlier than #9 are not numbered. I found #9-#16 dating from Feburaruy 1979 until March 1980. January and March 1979 contain five more unnumbered ordinances that say they are part of the central city rezoning. ↩
-
Downzoning is when the city updates the zoning code to be more restrictive. For example changing a lot from R2 (which allows duplexes) to R1 (which does not) is downzoning. At least one person was planning to build a duplex when this downzoning happened, and came to the council meeting to protest. ↩
-
R3 is all medium-density multifamily, but there are gradations within R3 that allow for different numbers of homes per acre and minimum lot sizes. Current R3 zoning standards are here. confusingly, higher numbers in R3 correspond to lower density. For example R3-1 can have 5 homes on a 15,000 square foot lot, whereas R3-2.5 would need a 17,000 square foot lot to build 5 homes. ↩