TOZ at Mountain View Station
Transit-Oriented Development (TOD) is the concept that high-density development should happen around high quality transit stops.
Mountain View has had several passes at what it calls transit-oriented development in the past, most recently with the East Whisman Precise Plan. The (so far mediocre) results of the plan illustrate that the city does not actually do TOD. What the city does is create zoning that allows for TOD, and then hopes someone else does the actual development. I call this Transit-Oriented Zoning, or TOZ.
There are some pushes at the local and state level to get more housing zoned near transit. Below I analyze the half mile around the Mountain View Caltrain station, looking at how much housing is built, how much housing is allowed to be built, and what changes are currently being considered.
Current Conditions
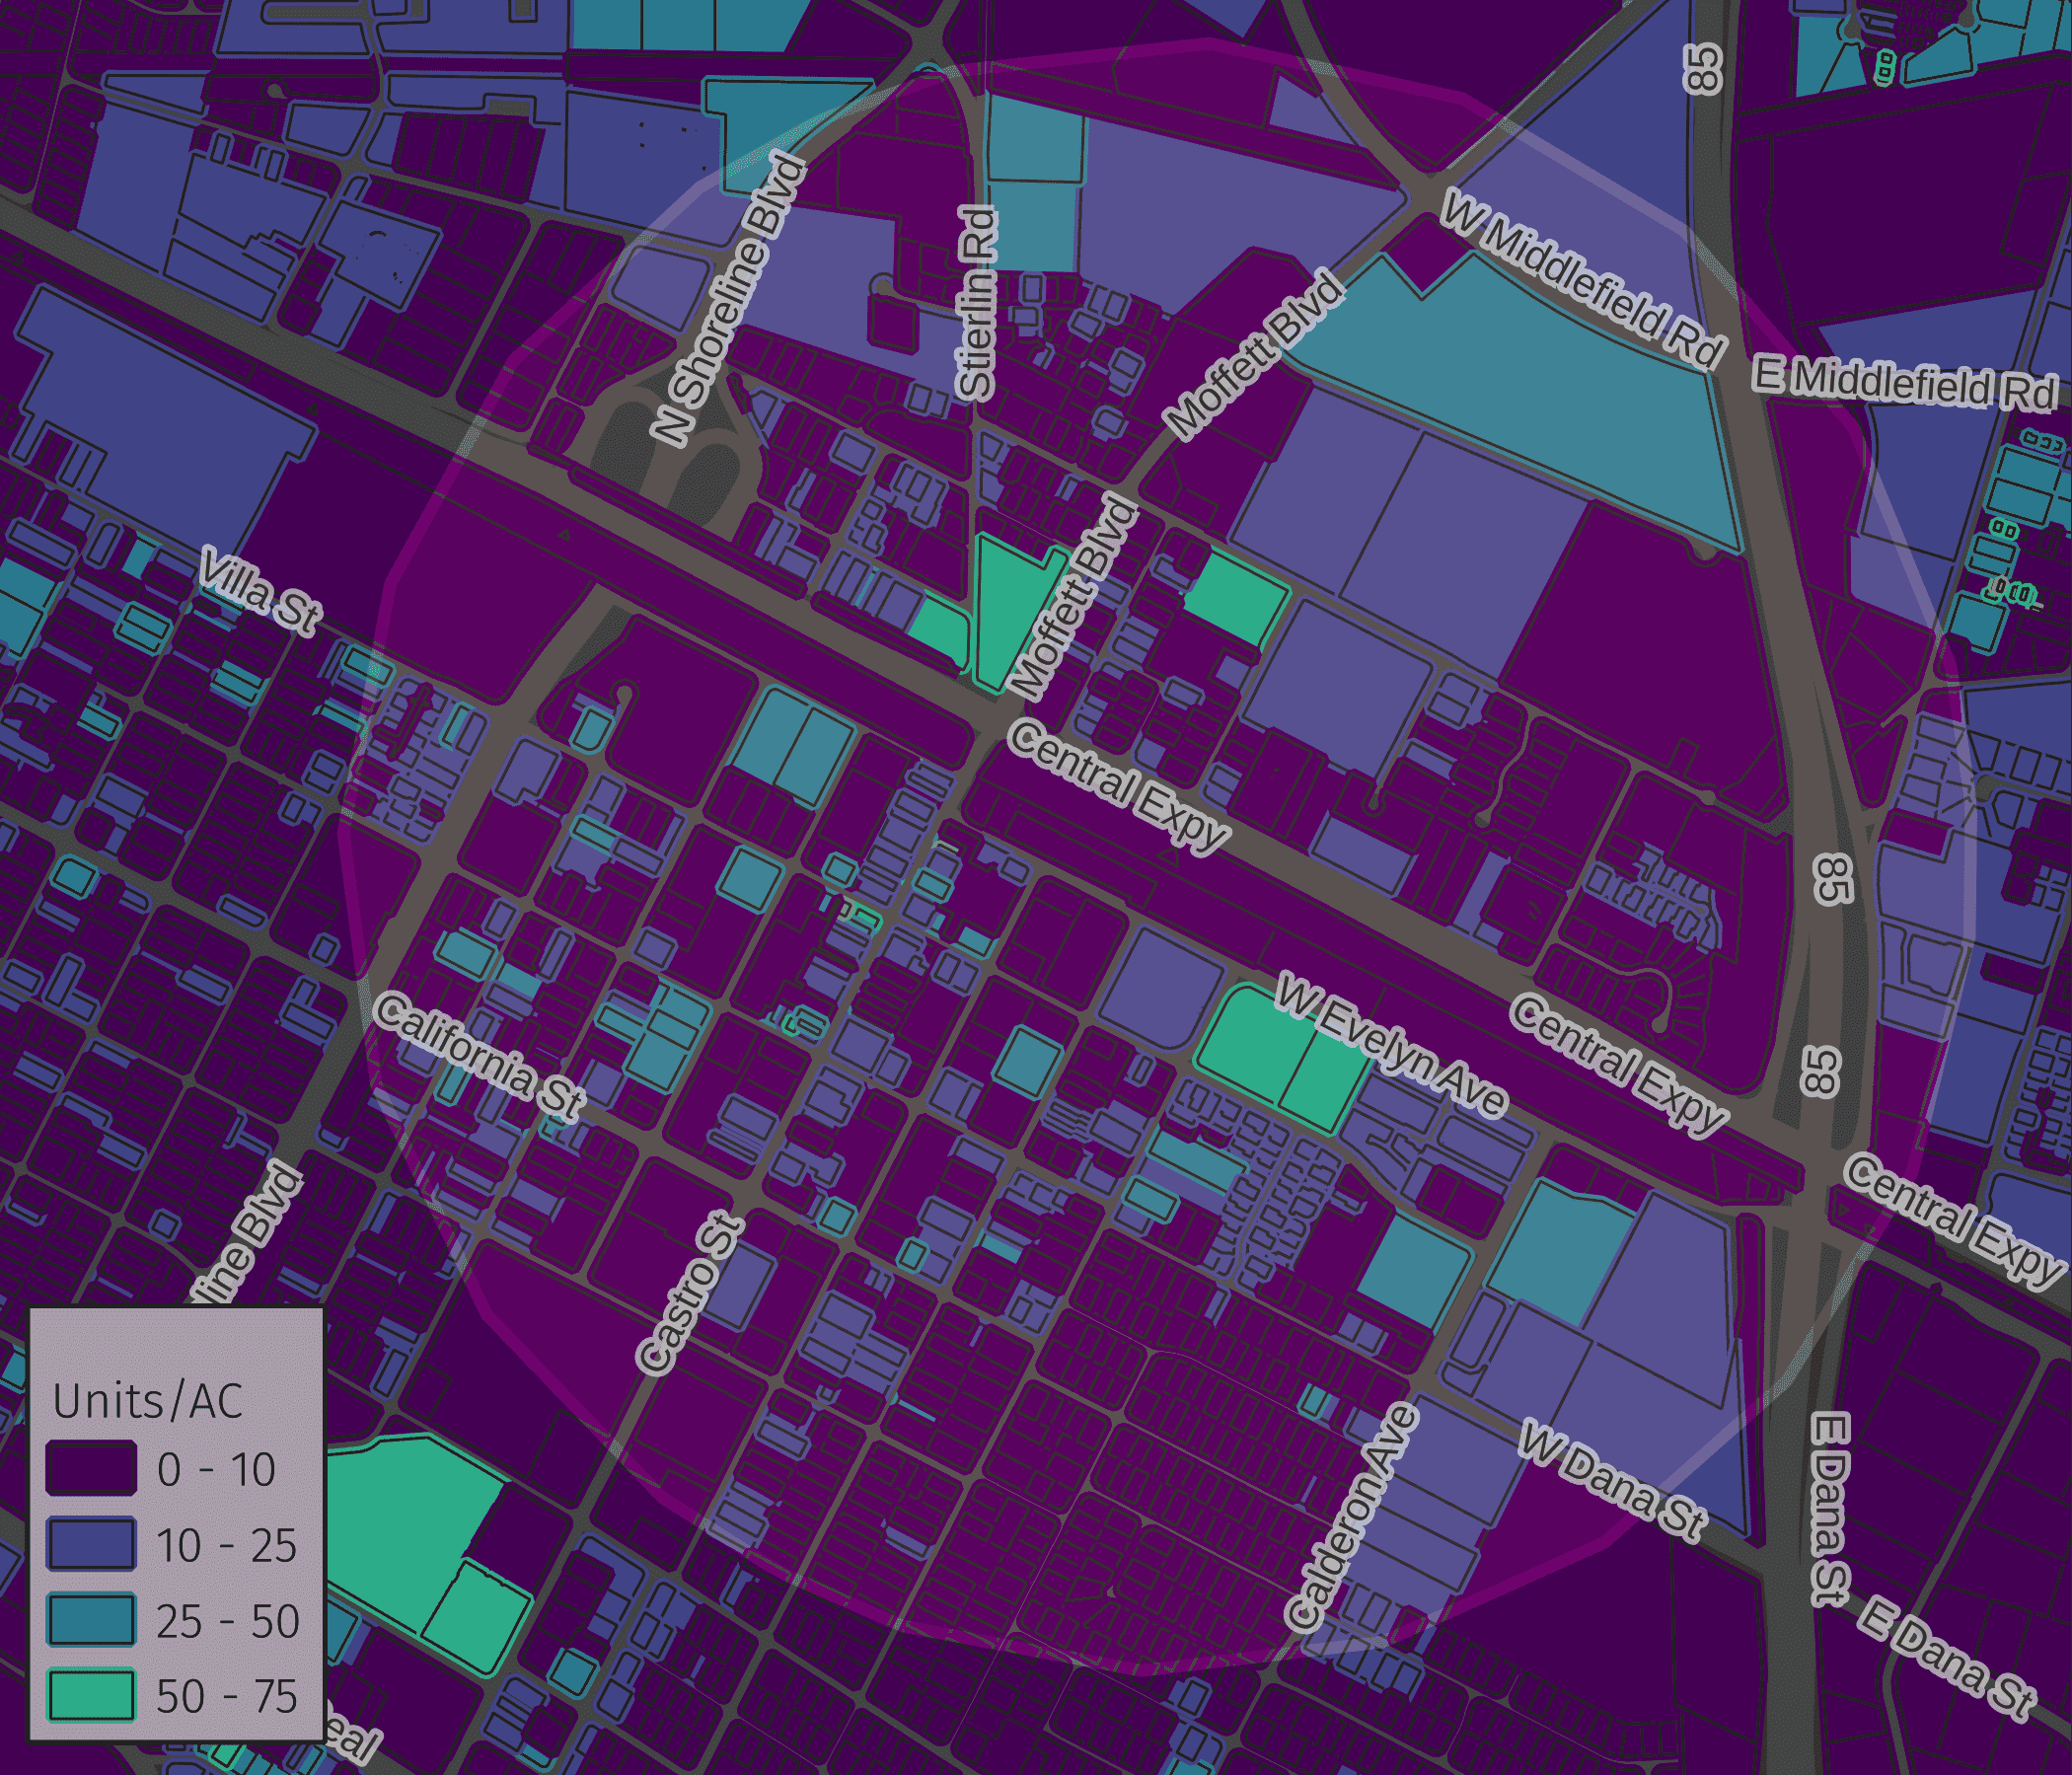
Current Zoning
The City’s general plan provides general designation of land use. The zoning map subdivides these areas with more specific rules, and when even more fine-grained control is desired the city uses a precise plan
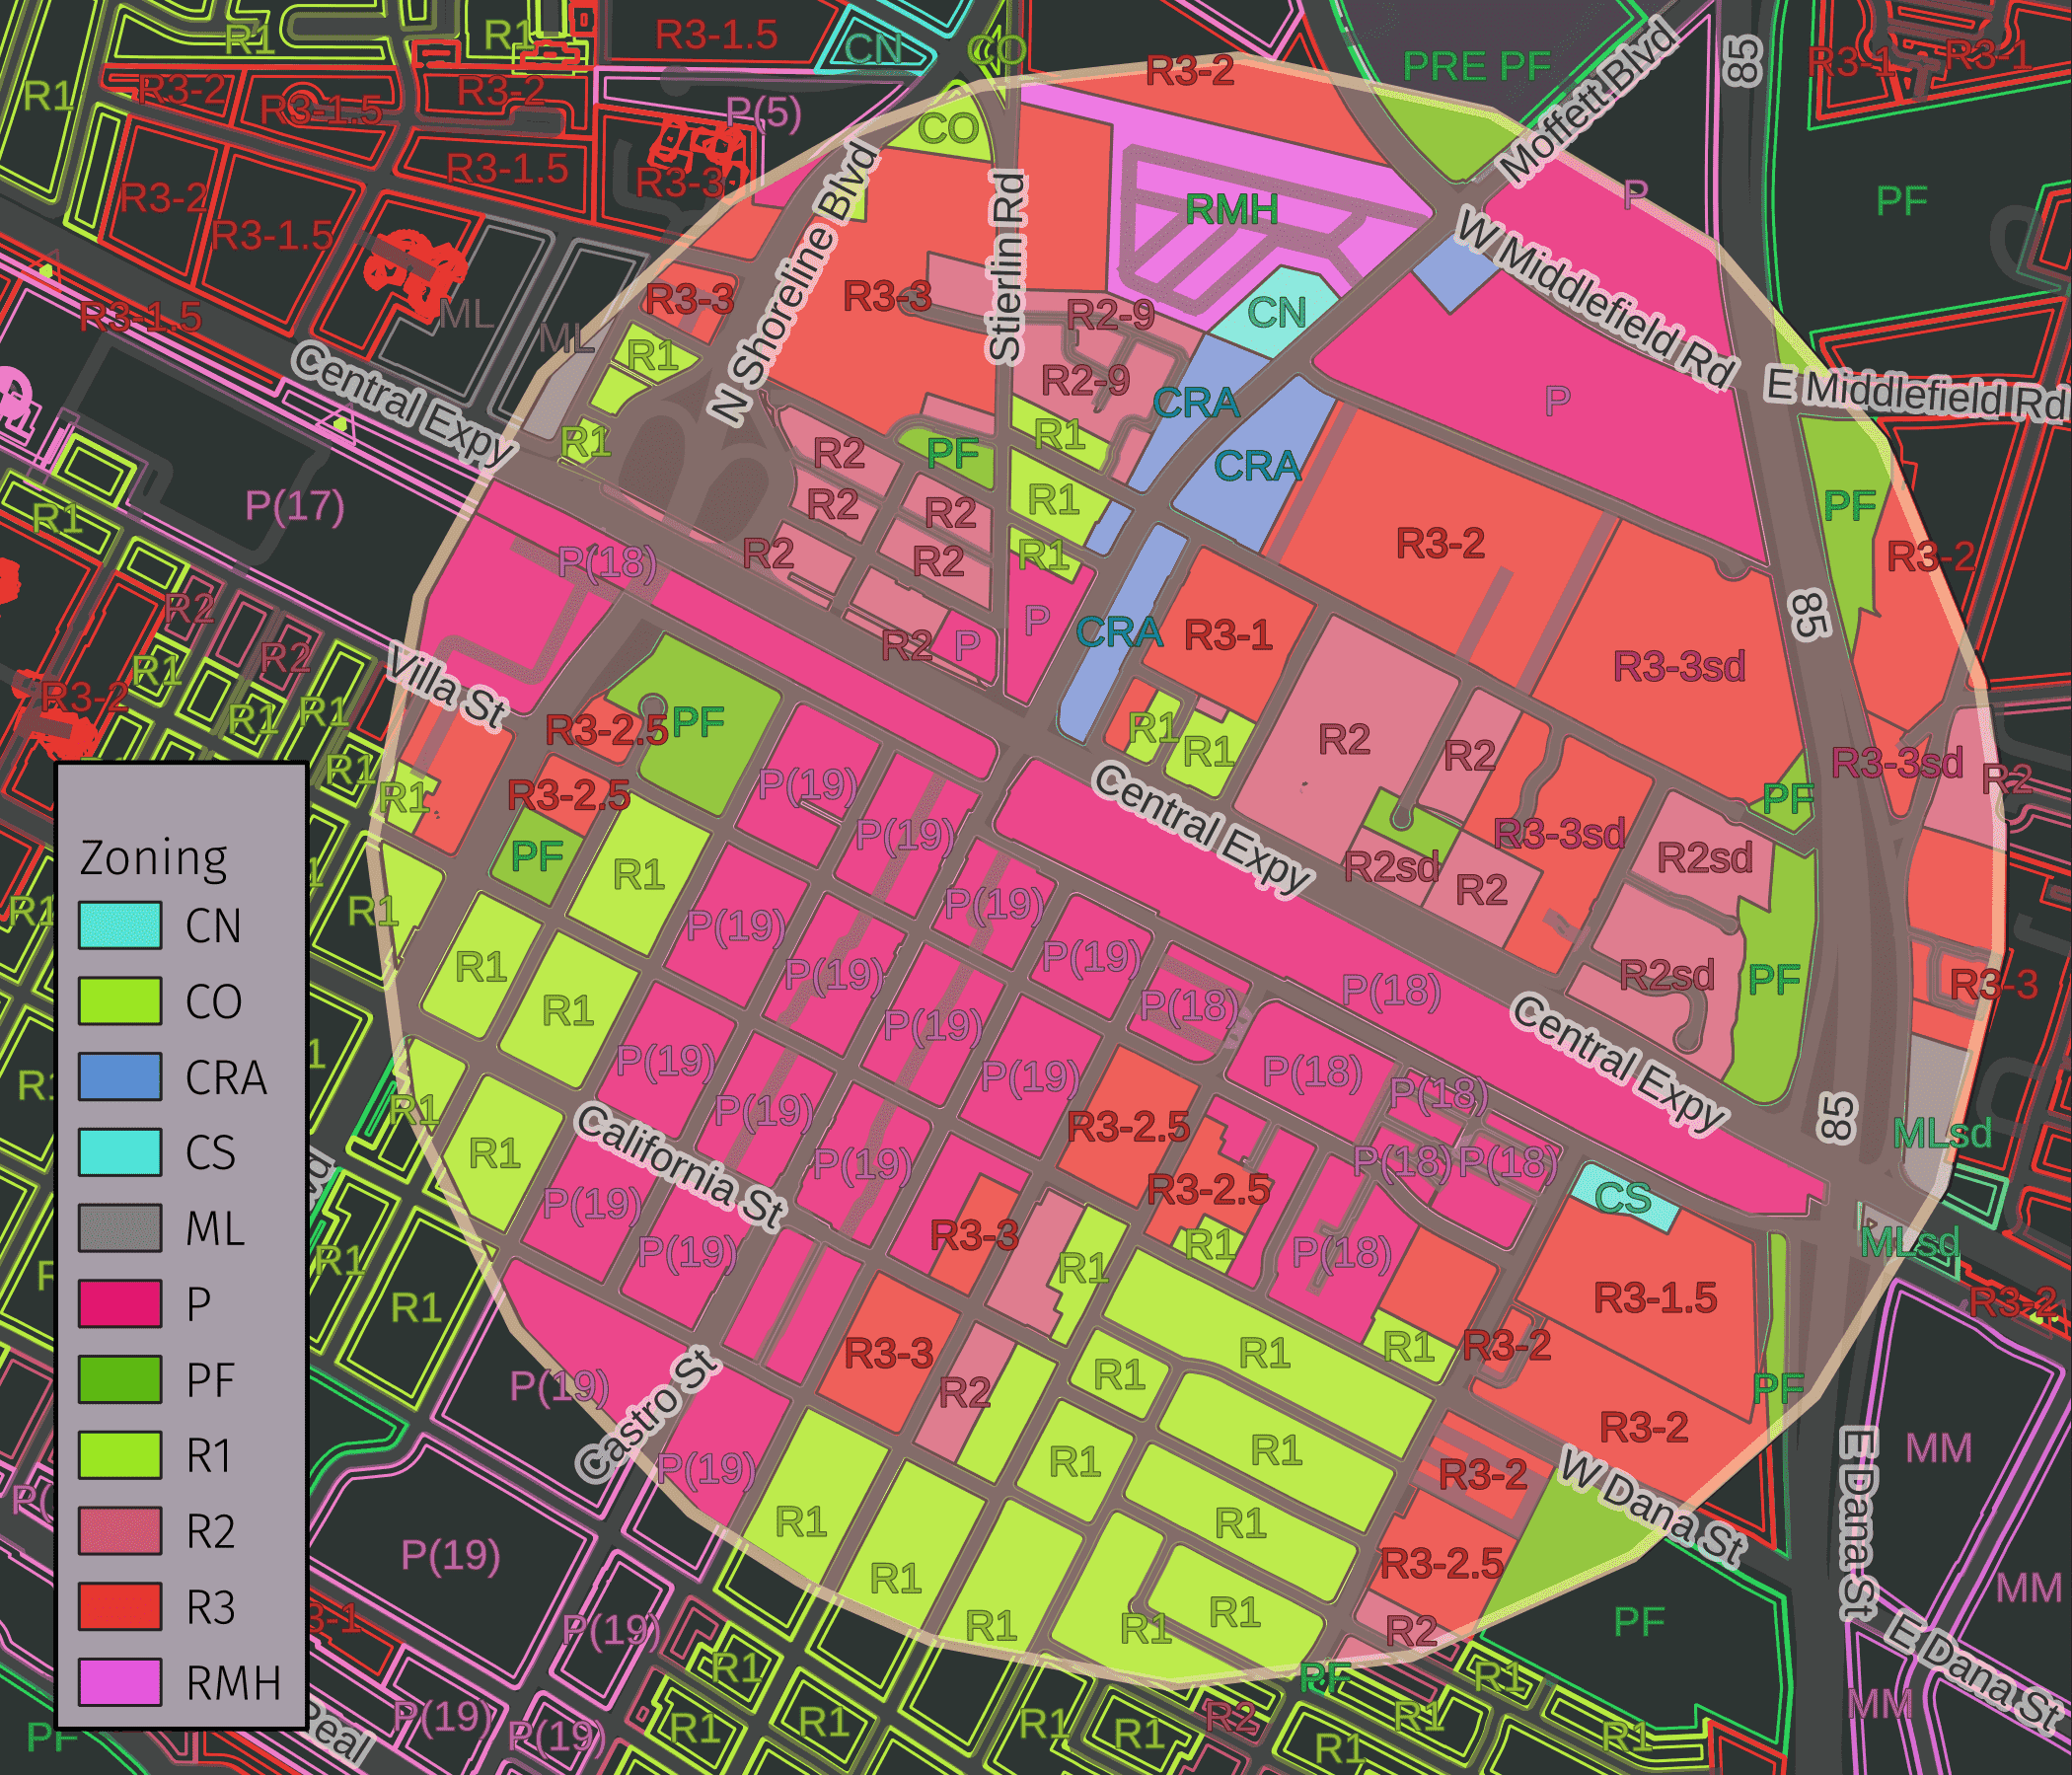
Most of the station area (57%) is designated as exclusively residential, about half low-density and half medium-density. An additional 34% of the area is designated mixed-use, allowing residential in medium to high densities.
| Zone | Area | Description |
| P | 31.9% | Precise Plan |
| R3 | 28.2% | Medium Density |
| R1 | 15.6% | Detached Single Family |
| R2 | 10.6% | Duplex |
| PF | 5.8% | Public Facility |
| RMH | 3.3% | Mobile Homes |
| CRA | 2.4% | Commercial/Residential Mixed |
| ML | 0.8% | General Industrial |
| CO | 0.4% | Office |
| CN | 0.4% | Neighborhood Commercial |
| CS | 0.2% | Commercial Services |
Most of the area around the transit center allows some kind of home to be built. The most common residential designation is R3, which allows ~30-40 homes per acre. The second most common is R1, which allows one home on a minimum lot of 6,000 sqft; about 7 homes per acre.
Zoned Capacity
I am not accounting here for state laws such as SB-9, ADUs and JADUs which would increase densities, especially for low-density areas. Nor am I accounting for setbacks, FARs, minimum width, minimum frontage, density bonus laws, and so on that affect densities depending on development type, lot size and other factors. These numbers should be taken as approximate.
Using these simplified calculations I estimate the number of residential units currently built in the station area to be about 4,500. And the number of units allowed to be built under the current zoning to be around 6,500. This superficial analysis gives us around 2k homes that can be built in the station area with no changes to zoning.
The superficial analysis has 2 major flaws:
-
Many areas are already built out at more than their zoned capacity. Using variances, conditional-use permits, and density bonus laws the city council can allow for a development to be built at higher density than zoned for. Additionally many buildings predate the city’s zoning laws and were built to higher density than is currently allowed. For example many single-family homes in old mountain view have a 4-plex or 6-plex in the backyard. Completely illegal under current zoning.
-
Many areas are very unlikely to be redeveloped. Condo or rowhouse developments do not have a single owner and are unlikely to add capacity even if allowed. City-owned property such as parks and city hall are unlikely to be redeveloped into residential housing.
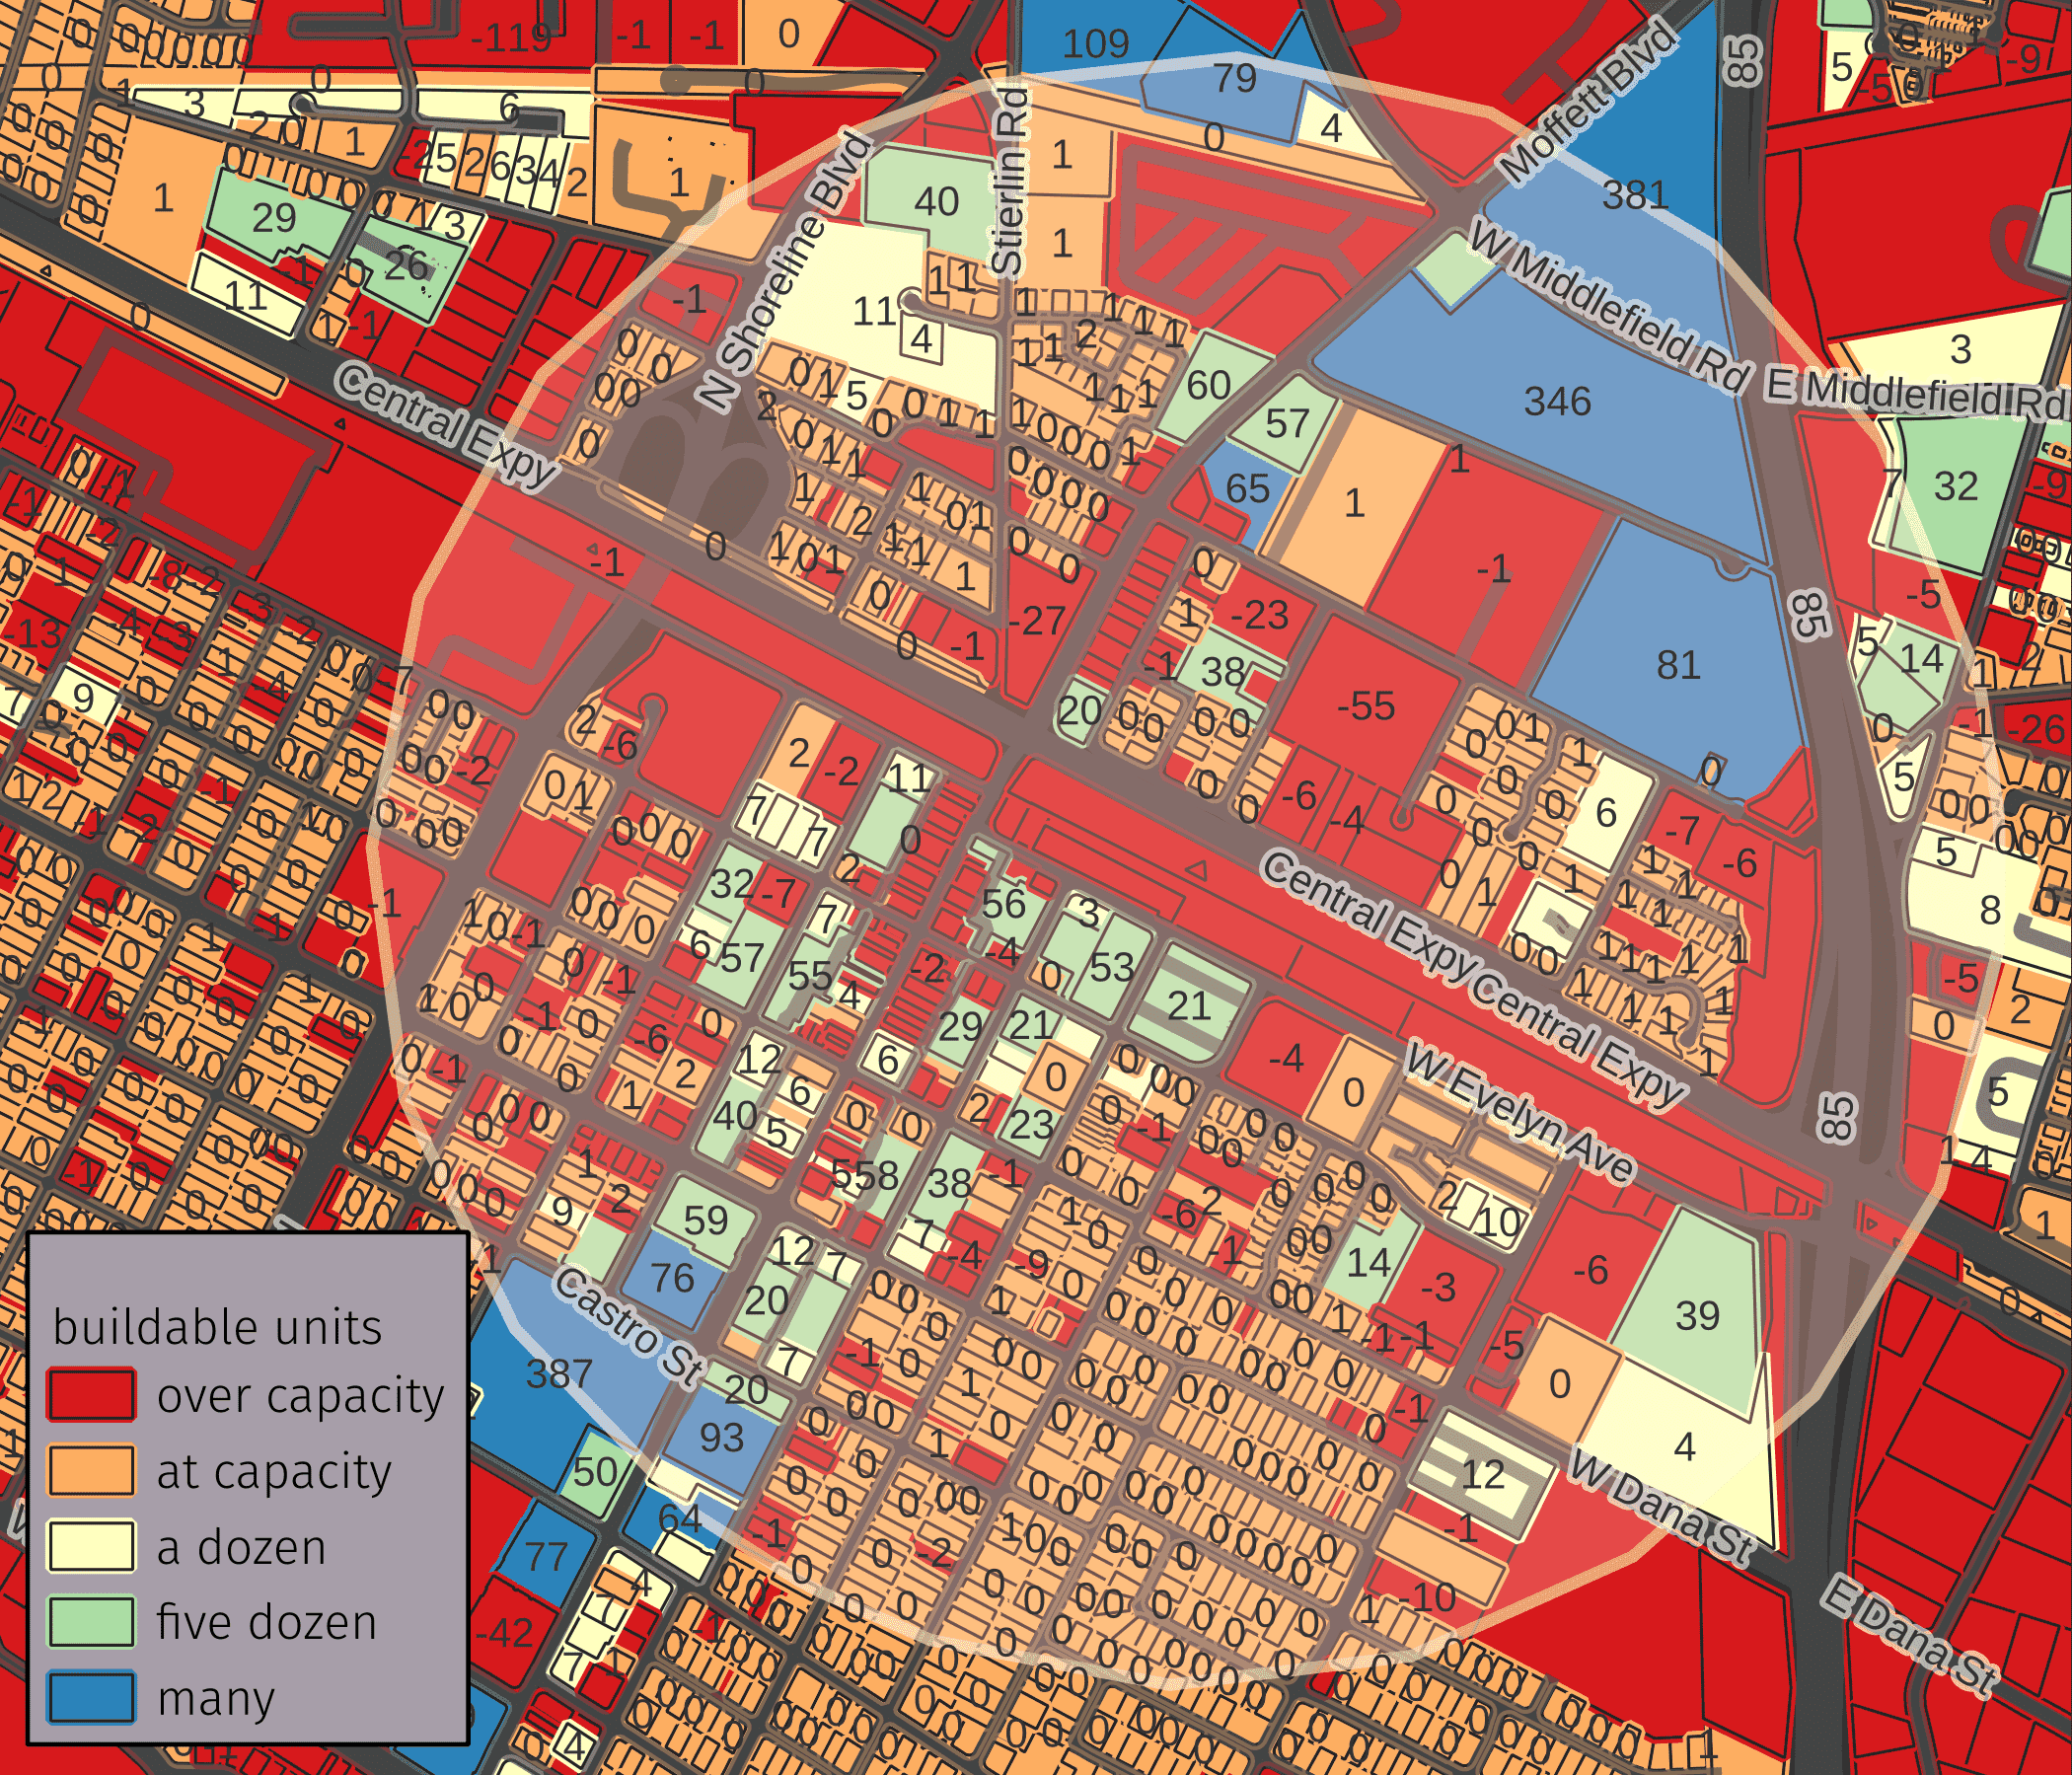
Most of the R1, R2 and R3 areas were downzoned back in the 70s, so it is unsurprising they are mostly at capacity. Available zoned capacity is mostly in precise plan areas.
Downtown
The zoned capacity in downtown is over 1,000 homes. Over half of that capacity is on city owned land, most of it currently used for free parking. The city owns 9 surface lots and 2 parking structures within a half mile of the transit center. The city has plans to build housing on one lot, and build a new parking structure on another.
The areas downtown which currently have housing are built at maximum zoned capacity. The office and commercial areas have a capacity of around 350 units.
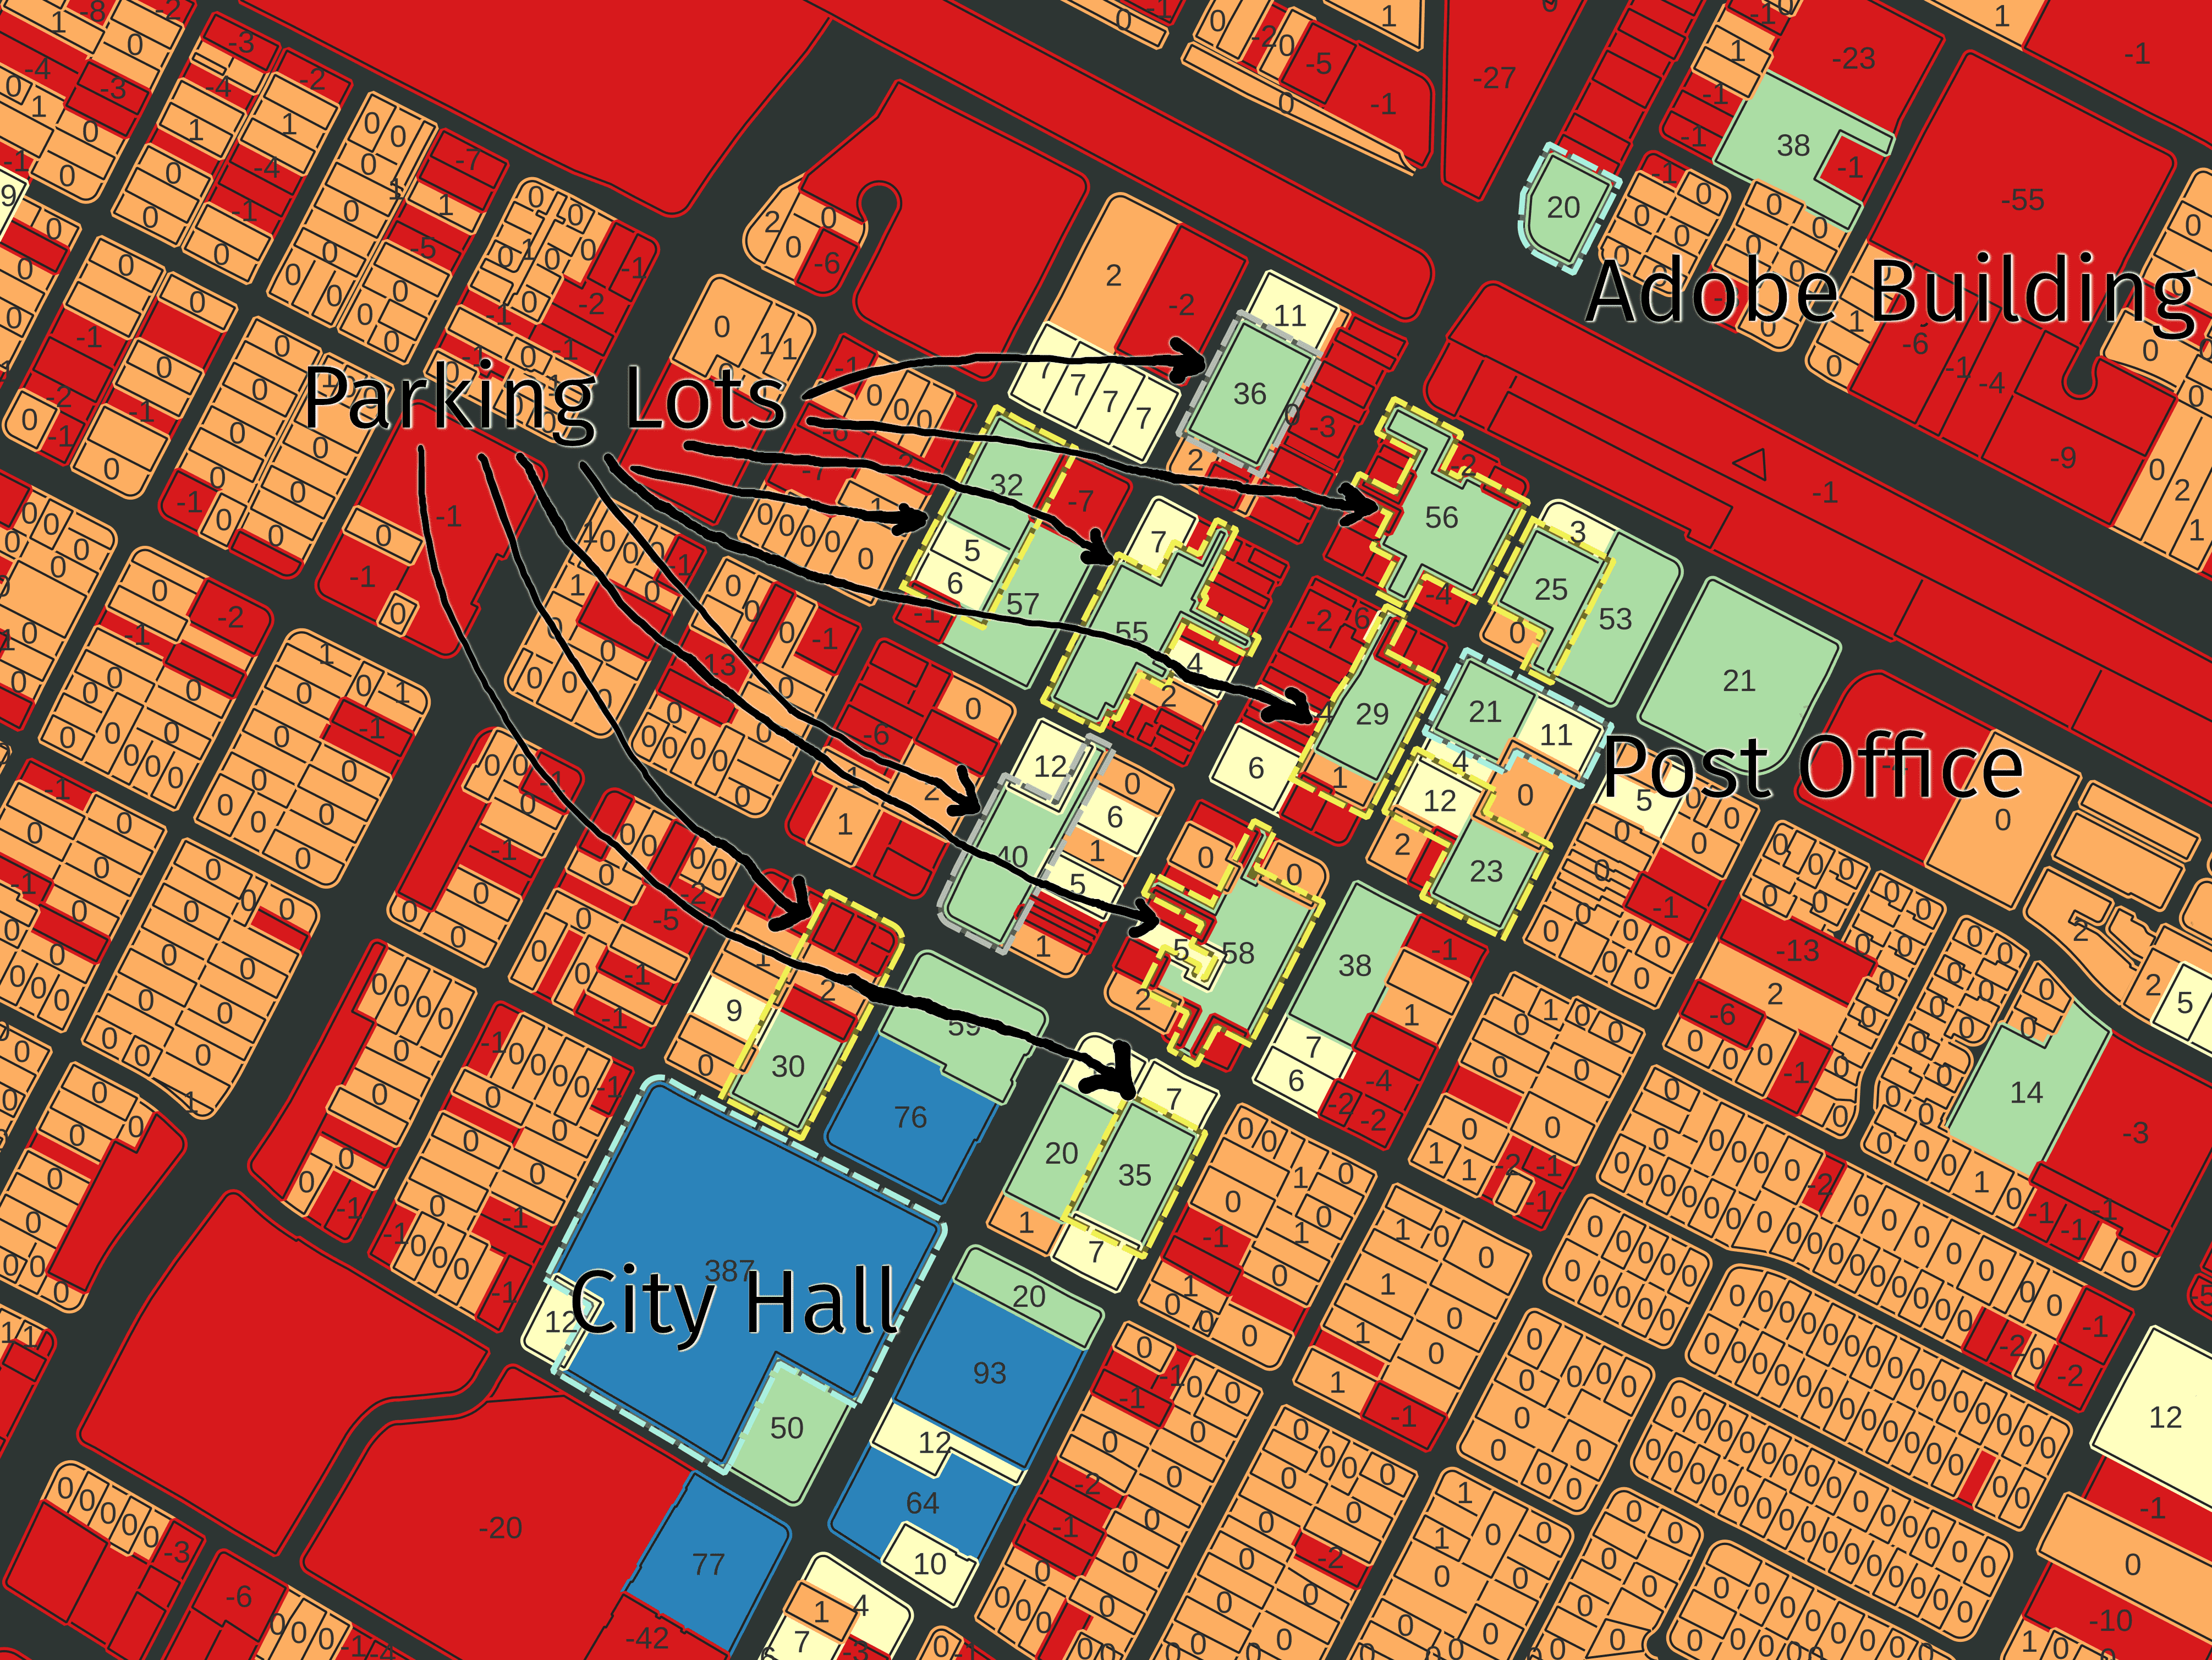
The downtown precise plan strongly favors consolidation. The larger the lot, the greater the allowed density. This is why the development on lot 12 can provide 120 homes: it will consolidate 8 parcels into a single development, effectively doubling the zoned capacity.
This is also why most of downtown does not have additional capacity in the map. Theoretically if someone were able to purchase many adjacent parcels they could build more homes than this map indicates.
Most of the multi-family zoning in the city has this idea of higher density on larger lots, but it is most extreme in the downtown precise plan. A 6,000sqft lot has the same zoned capacity as R1: low density. But join three 6,000sqft lots together and the allowed density grows by over 5x.
Evelyn Avenue Corridor
The second largest precise plan in the station area is the Evelyn Avenue Corridor Precise Plan
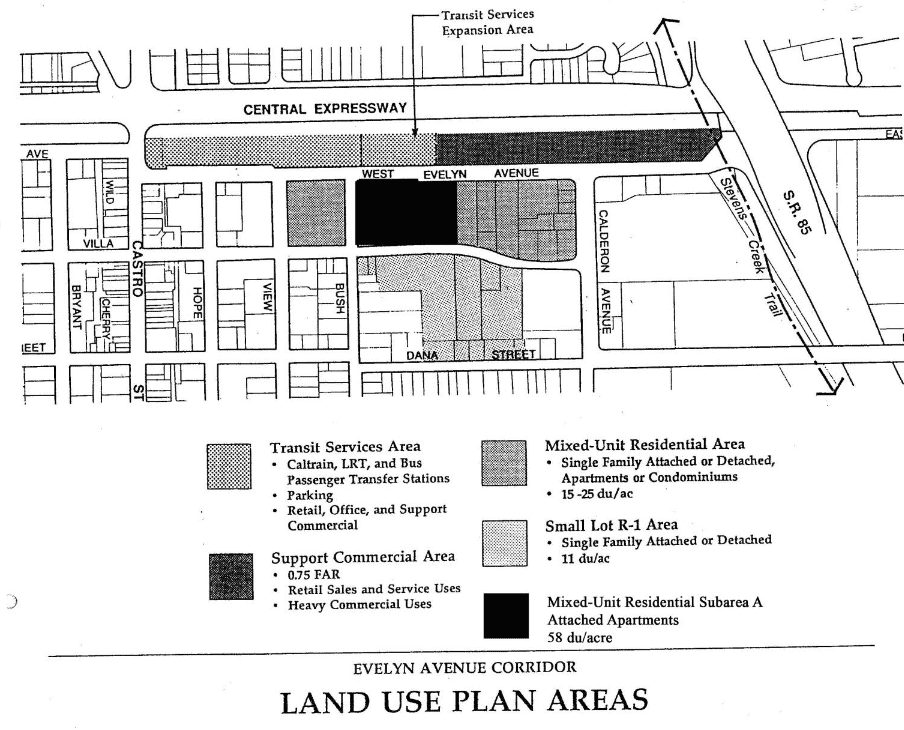
The plan consists of low, medium, and high density areas, as well as a commercial area.
Most of the area is built out to max density. Remaining un-redeveloped are SFV Portuguese hall, La Fiesta, and two auto repair shops. If these were built to maximum allowed density it would yield around 30 homes.
Middlefield
Between Moffett and HW 85 are three large areas with available capacity of over 800 homes. However two of these are currently occupied by large condominium complexes. So only one, 555 W Middlefield, is likely to be redeveloped.
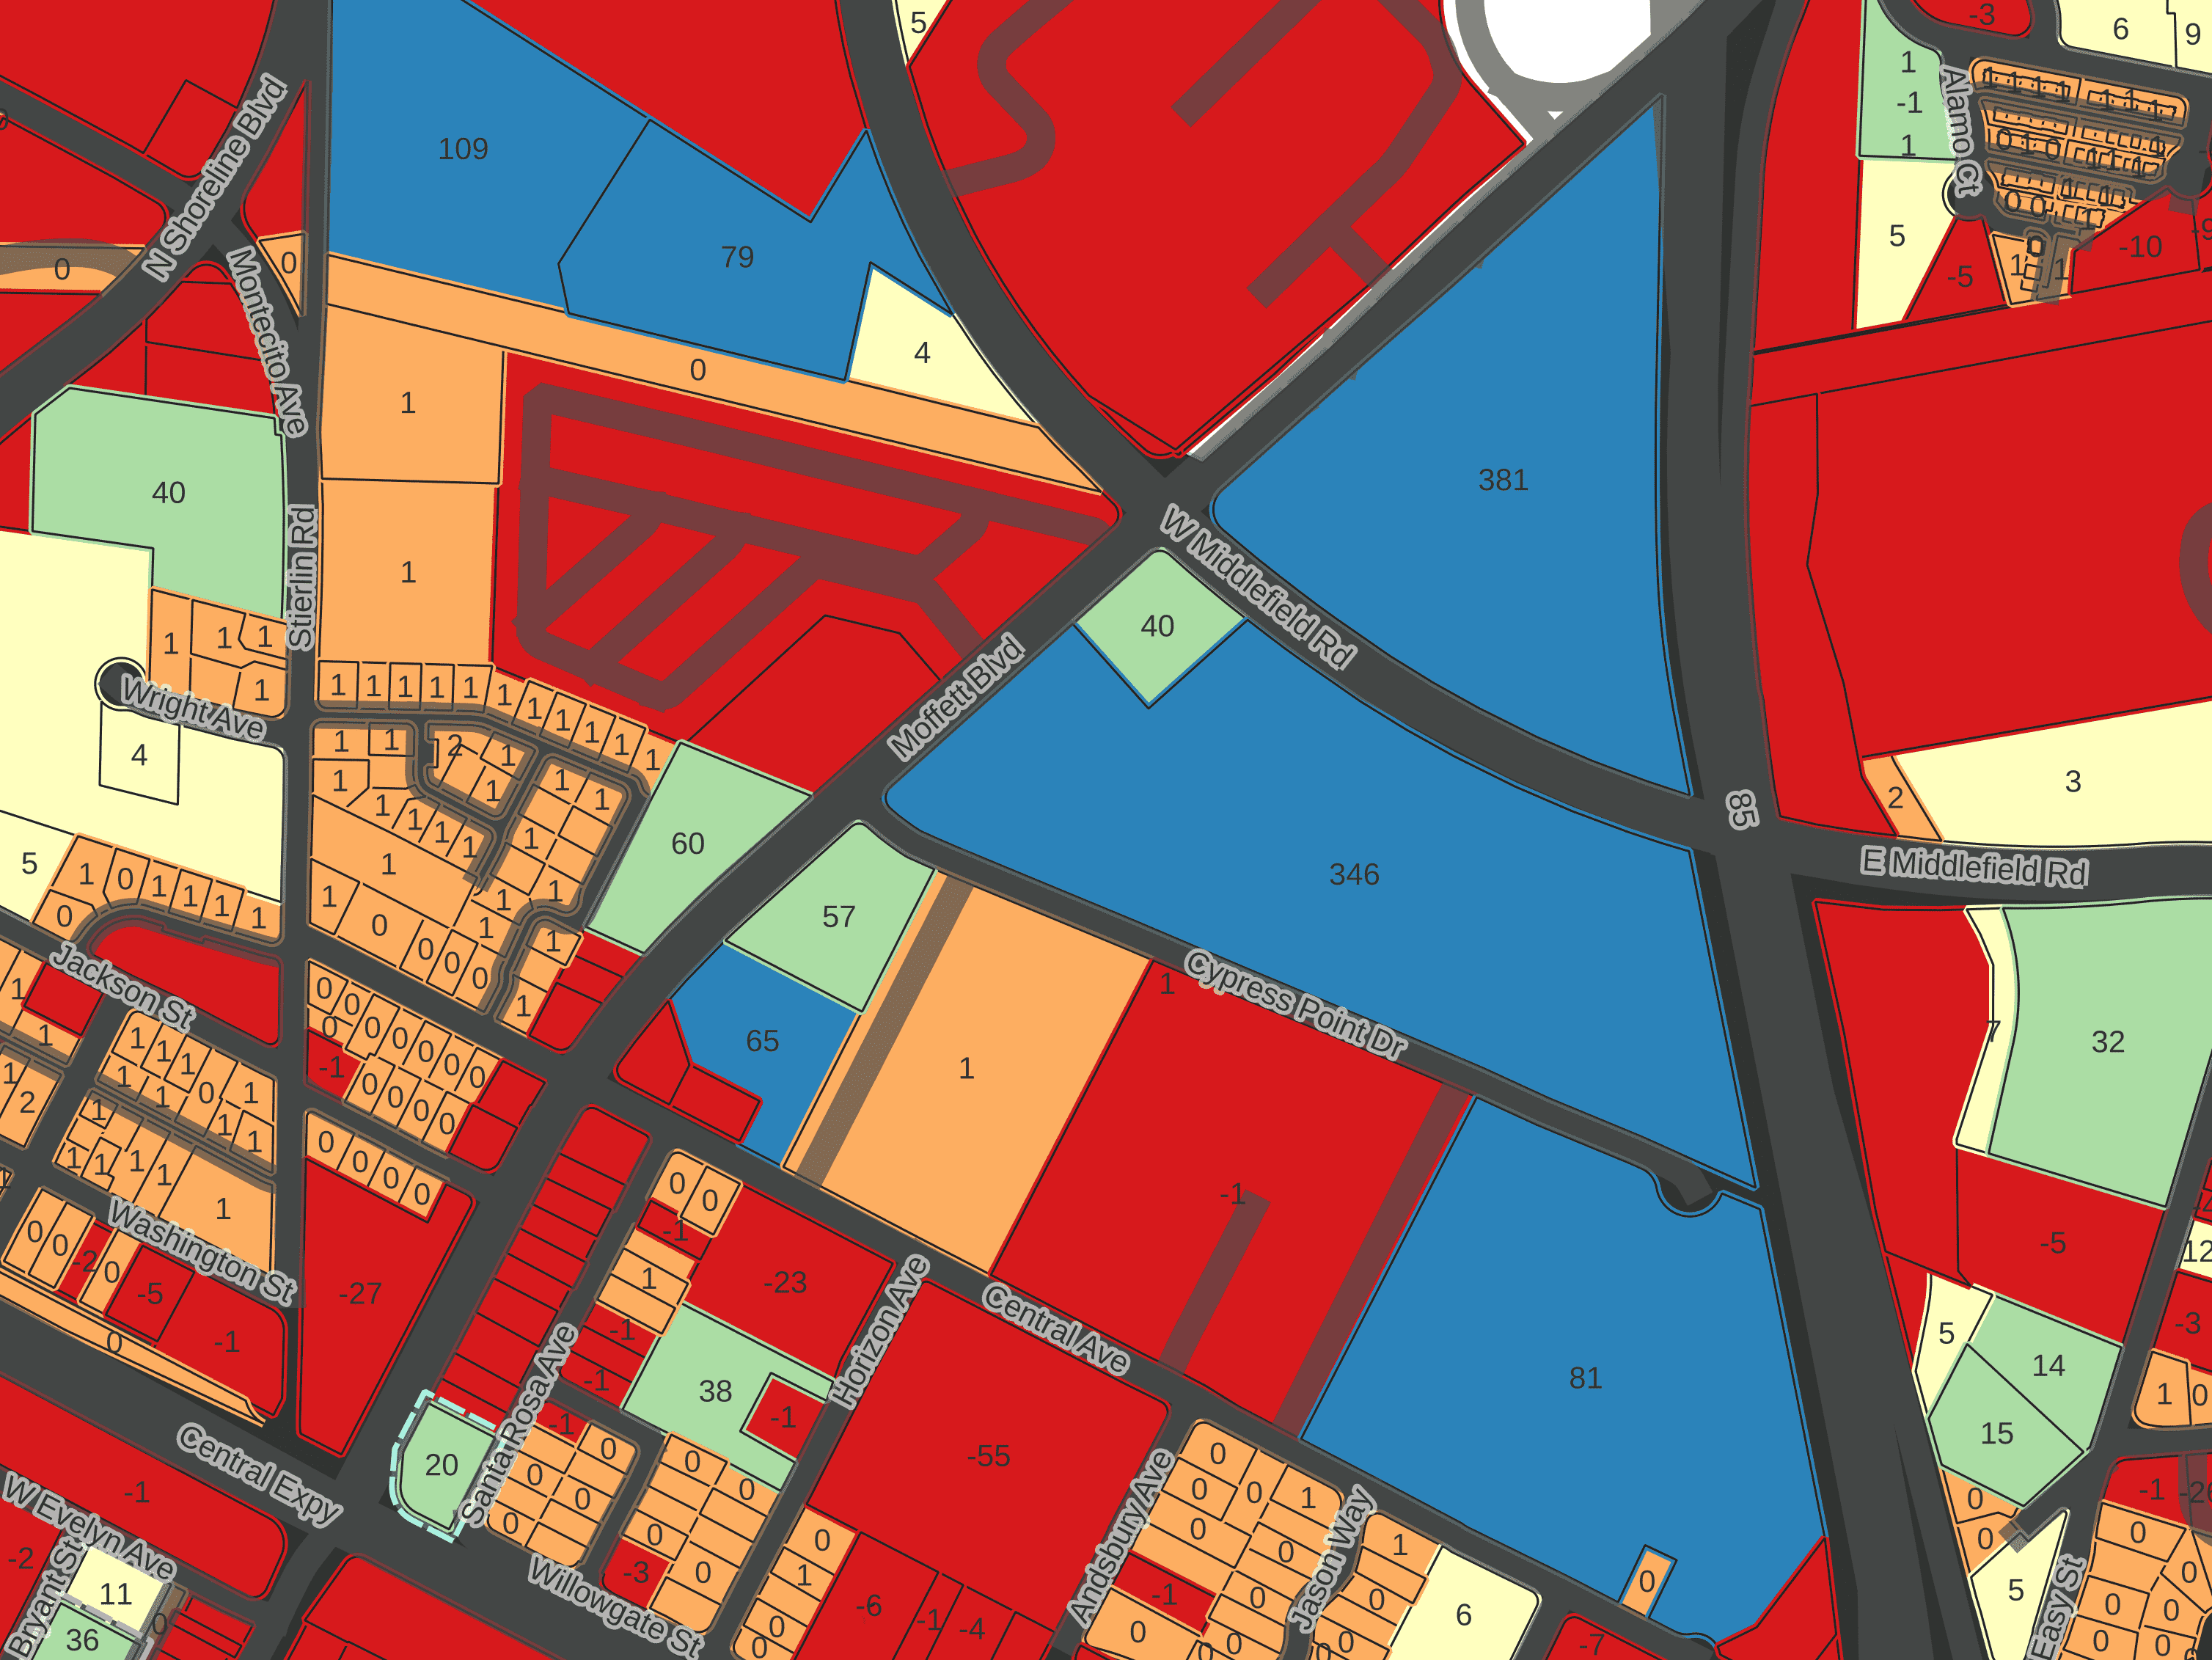
555 W Middlefield is interesting. It is zoned as a precise plan, but neither the city nor the owners seems to know where the actual plan is. So I used the maximum density allowed under the general plan to figure out it’s “zoned capacity”. There is currently a proposal to build an additional 323 units at the site, which would bring it in line with the general plan maximum. This is at the third such proposal, with the earliest one I could find from 2015. The previous proposals (for the same number of units) were approved by council, but nothing was built.
Moffett
Most of Moffett Blvd is currently zoned CRA, which allows for both commercial and residential. However, there is a minimum lot size for any development in a CRA zone of 20,000 square feet. Most of the lots fronting Moffett are smaller, so cannot be redeveloped under current zoning without consolidation.
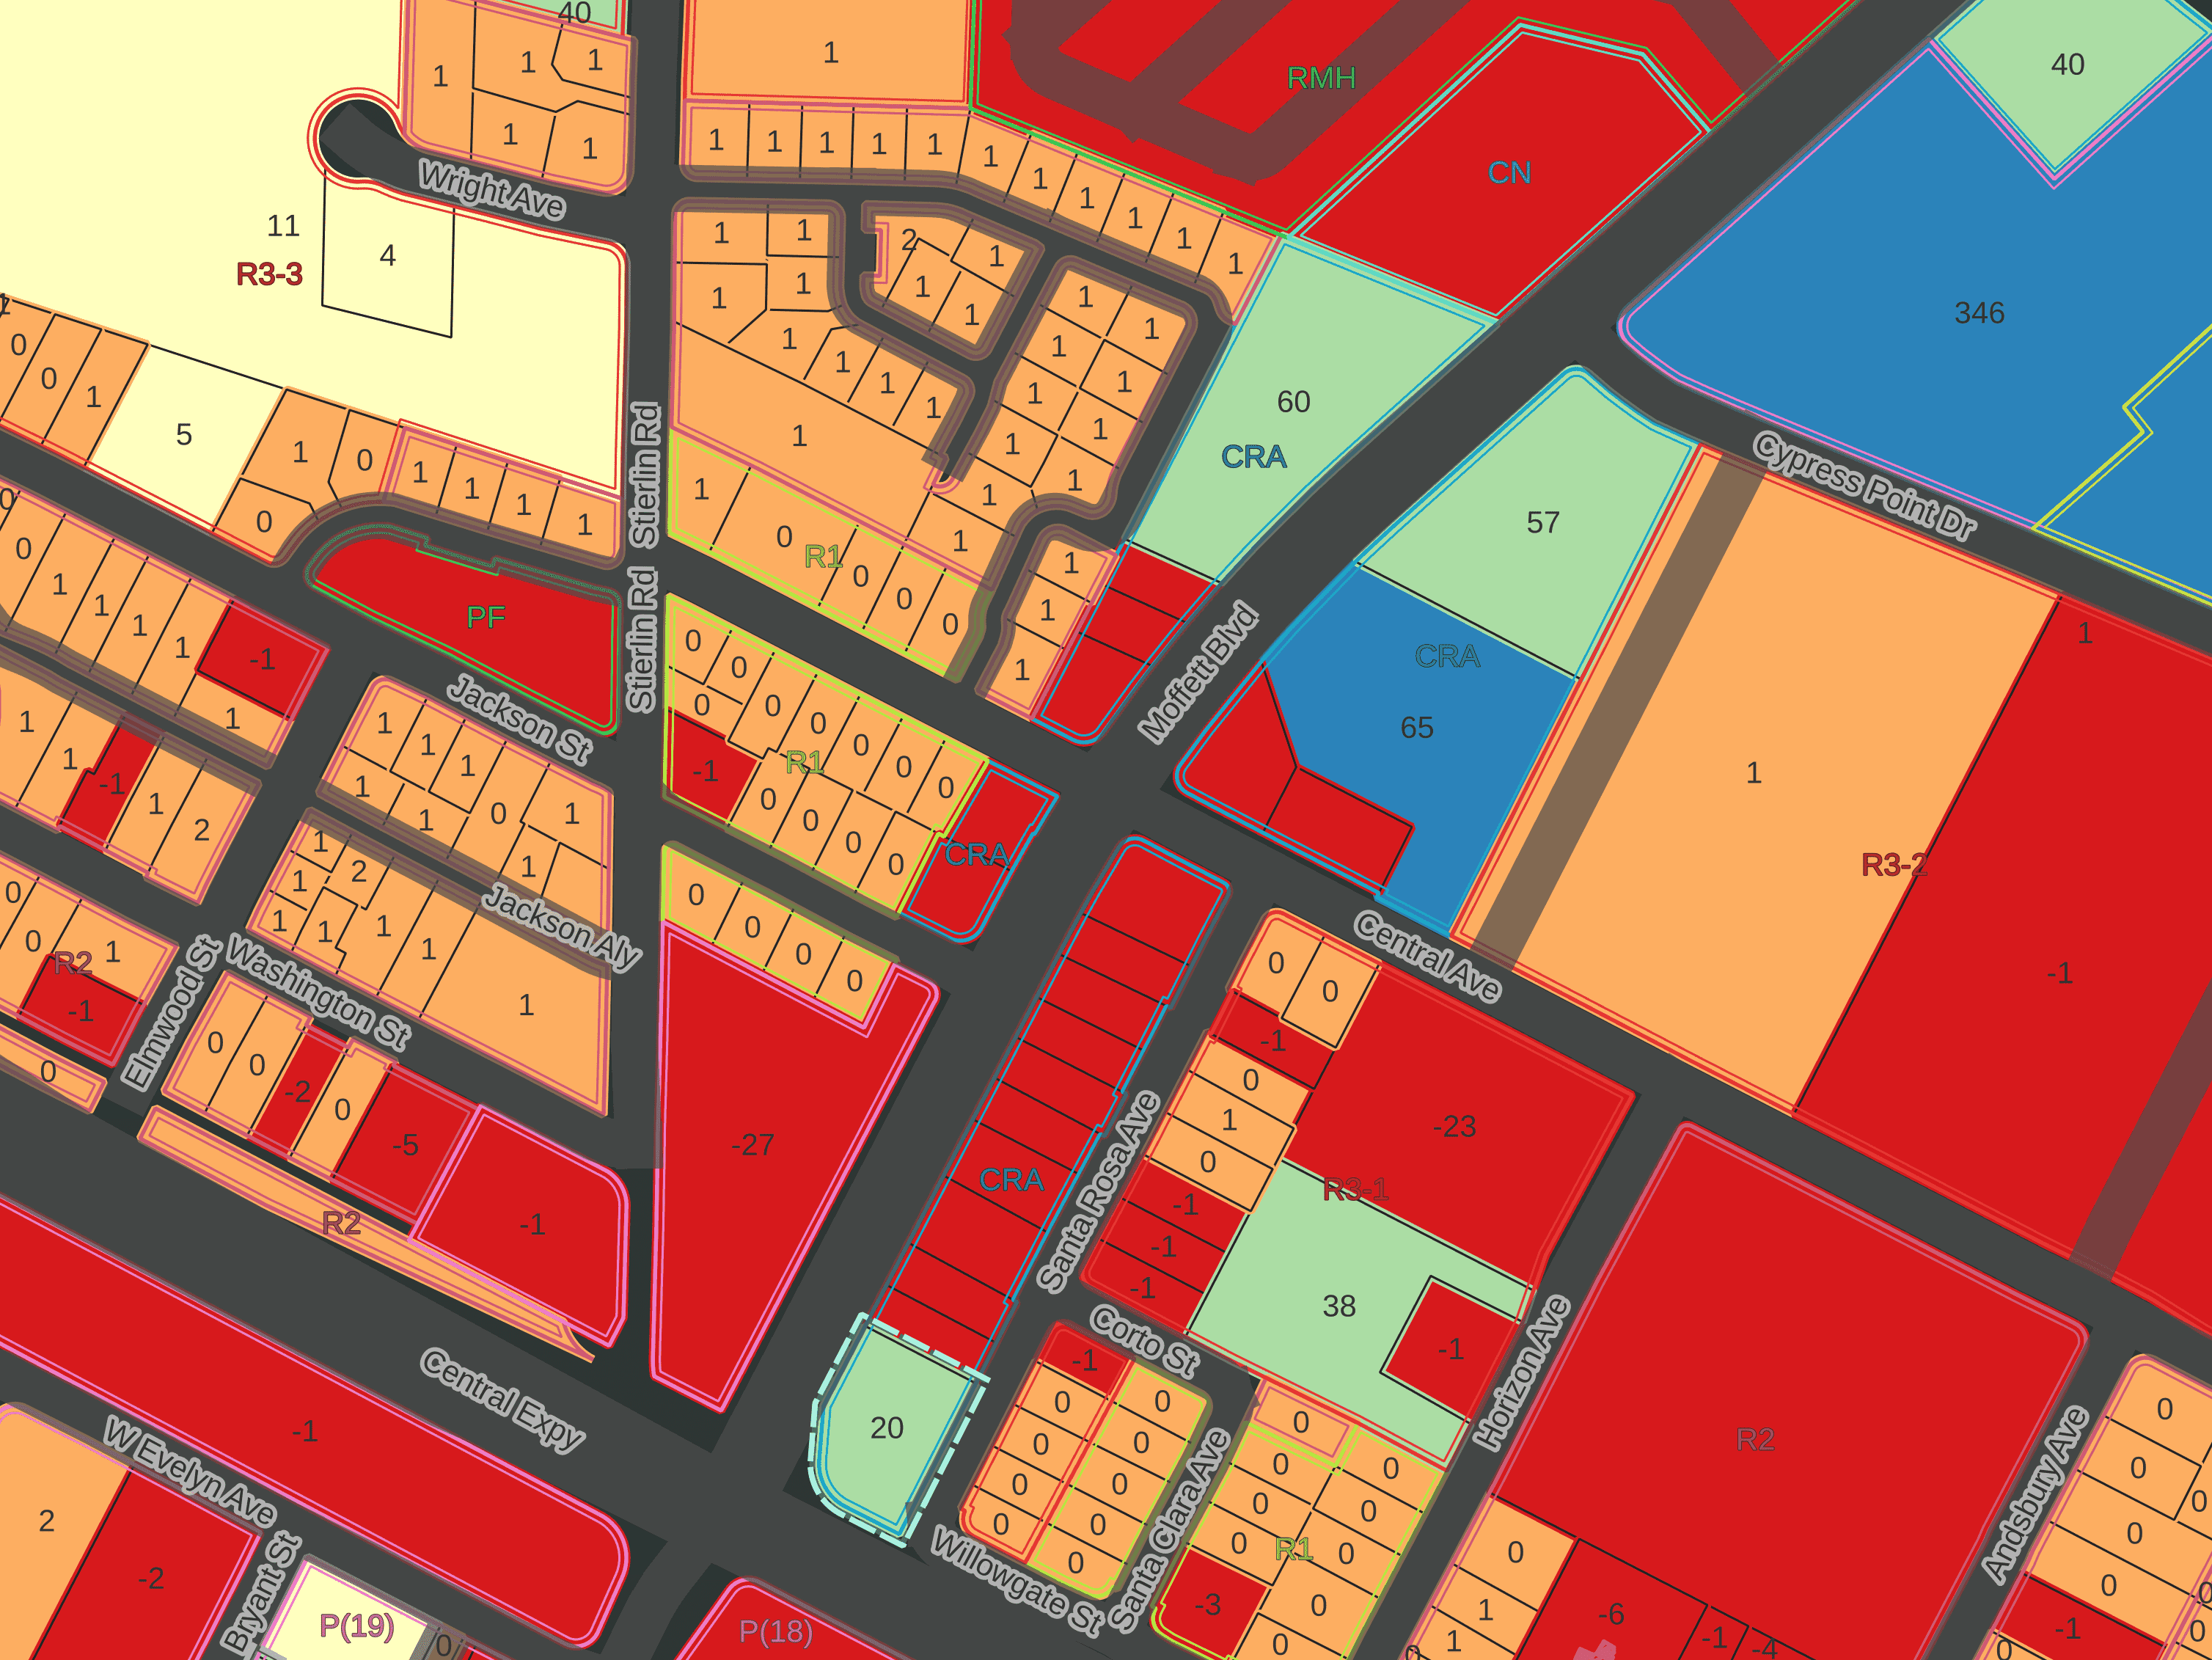
The city is working now on a new Moffett Boulevard Precise Plan, which could potentially result in an increase in allowed densities/
Changes
City Plans
Aside from the Moffett Blvd Precise Plan update just mentioned, the city is also working on an update to the Downtown Precise Plan. Both these projects are very early in the process so it is uncertain if an how much the might affect allowed densities in these areas.
Nearer completion is the R3 update. This initiative started out with the possibility of increasing allowed density for all R3 in the city. It seems like it will end with an increase to only some of the R3 areas. And only one such area is within a half mile of the transit center.
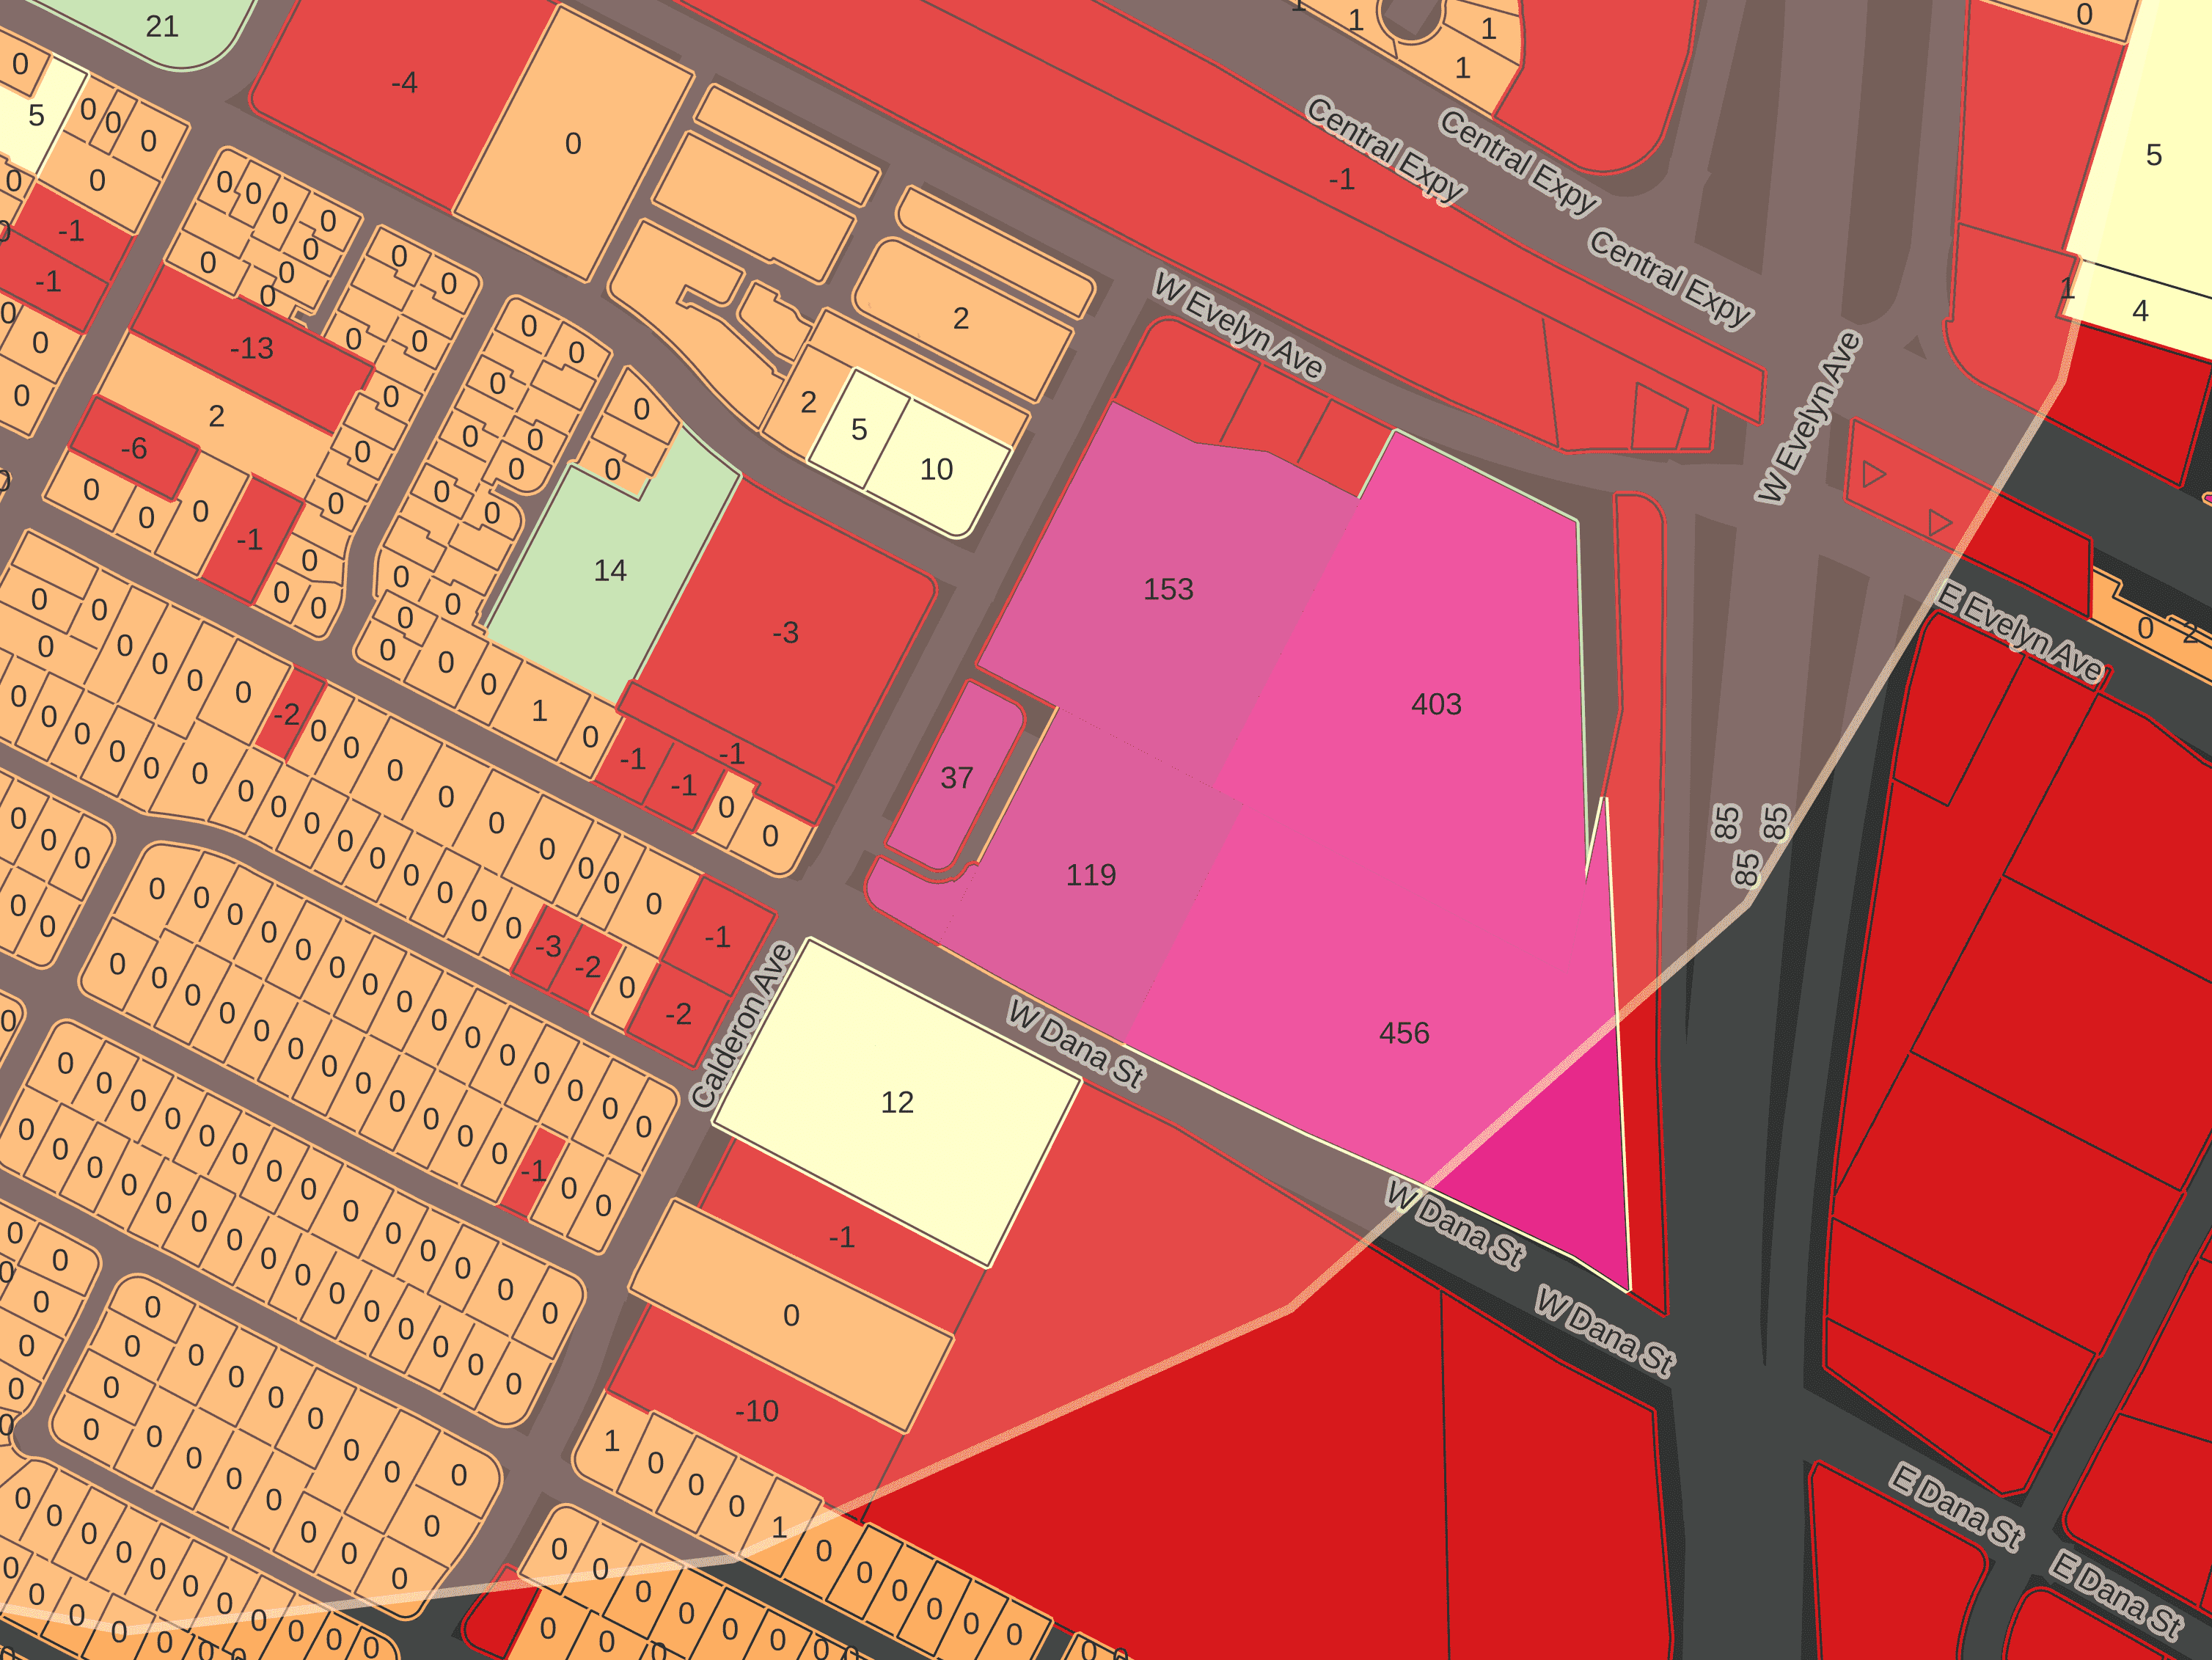
This would add over 1,000 units of zoned capacity to the transit center area. 90% of that zoned capacity is in a single apartment complex, which has the same owners as the 555 W Middlefield project mentioned above. So maybe don’t expect anything to get built there anytime soon.
Regional Incentives
The Metropolitan Transportation Commission does not have authority to make any housing policy. However, it can influence policy by use of grant funding via The One Bay Area Grant (OBAG). In order to receive over eight million dollars in cycle 3 the city of Mountain View had to, among other things, comply with state law re: accessory dwelling units and density bonuses.
As part of cycle 4 MTC is creating a Transit Oriented Communities (TOC) Policy. The policy applies to areas within a half-mile of transit centers, the same area we have been analyzing so far.
To be eligible for funding under TOC a city must, among other things, establish a minimum density for residential developments. The transit center area is “Tier 3”, meaning that to qualify under that plan the zones within a half mile of the transit center must have a average minimum density greater than 50 homes per acre, and cannot have an average maximum density less than 75 homes per acre.
“Average” here means some areas can have lower densities as long as other areas have higher densities to make up for it. So if the city rezoned the R3 and Precise Plan areas, which make up over half of the total area, to have a minimum of 100 and maximum of 150 homes per acre the city would then qualify for OBAC 4 TOC grants.
State Law
In the news recently is Senate Bill 79. This bill, if passed, would override city zoning to establish minimum residential densities near transit.
The current version of the bill would define the mountain view transit center as “Tier 1”, and as such would establish a density of up to 120 homes per acre within a quarter mile of the transit center, and up to 100 homes per acre within a half mile.
The bill allows a local jurisdiction to alternatively substitute their own transit-oriented development plan, provided that it allows for at minimum the same number of homes to be built as would be allowed under the state law.
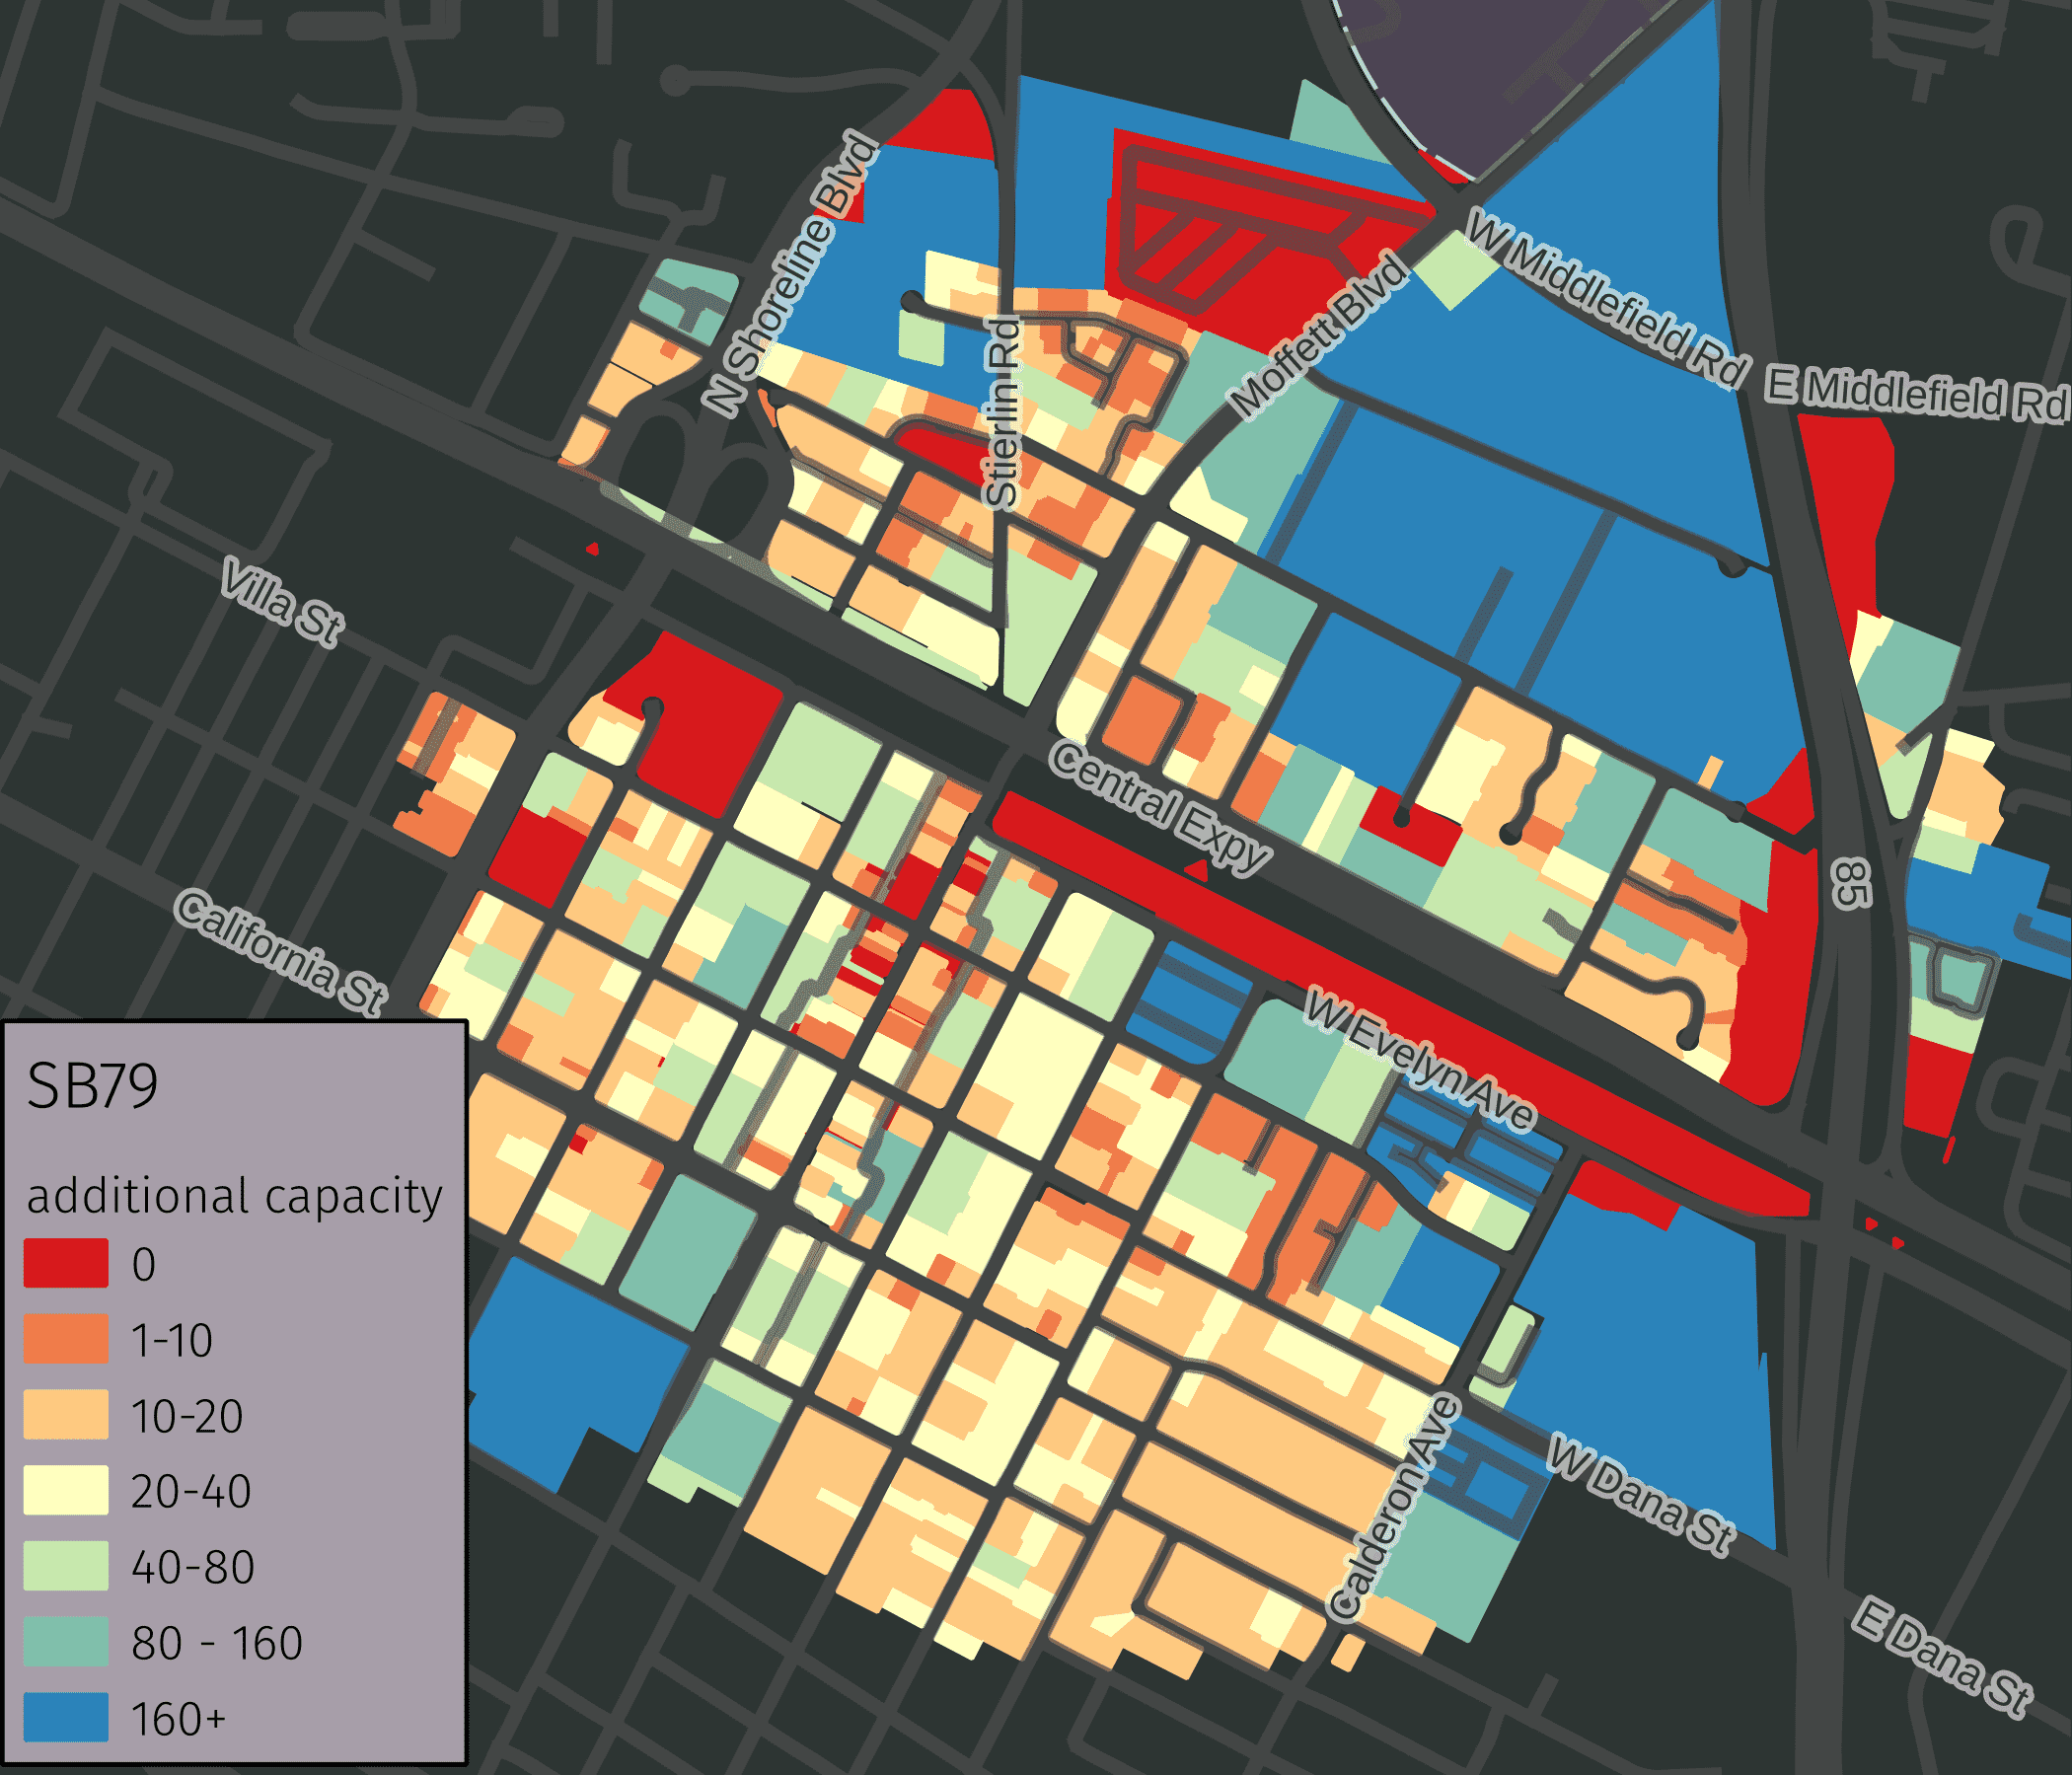
Superficial analysis suggests a plan that complies with SB79 would need to zone for around 25,000 additional homes within the station area.
Density and Intensity
Before concluding I want to go back to the Evelyn Avenue Corridor Precise Plan. This development actually contains the densest housing development in the station area.

On the left, at 61 units/acre, is the densest development in downtown. On the right, taking up the same amount of space (three floors and one city block), is a rowhouse development with a density of 16 units/acre.
Not only is density hard to visualize, but two developments can have wildly different densities and you would not even realize when walking past. Density has little to do with how peasant or unpleasant a development is to live in or to live near.
How we get “livable density” is beyond the scope of this post (which is already very long), but there are many books on the subject. My favorite is Soft City
Conclusion
Many people (myself among them) believe the best place to build dense housing is near transit. (I believe the opposite is also true: build more transit near housing). Mountain View does not build housing, but it does establish restrictions for what housing can be built. And most of the city is already built out. The city’s housing plans have only modest changes envisioned for the transit center area - we are relying on East Whisman and North Bayshore to fill out our housing needs.
Relying on a single developer has bitten us before. In 2006 the city created the Mayfield Precise Plan. This plan added over 1000 units of zoned capacity to the area north of San Antonio Station. To this date none of that housing has been built.
If we want housing to actually get built it makes sense to do broad upzoning. I am not alone. Both the state and MTC have plans that would require an order of magnitude more zoned capacity than currently exists. Allowing housing to be built is only the first step to actually getting housing built. But it is by far the easiest step.