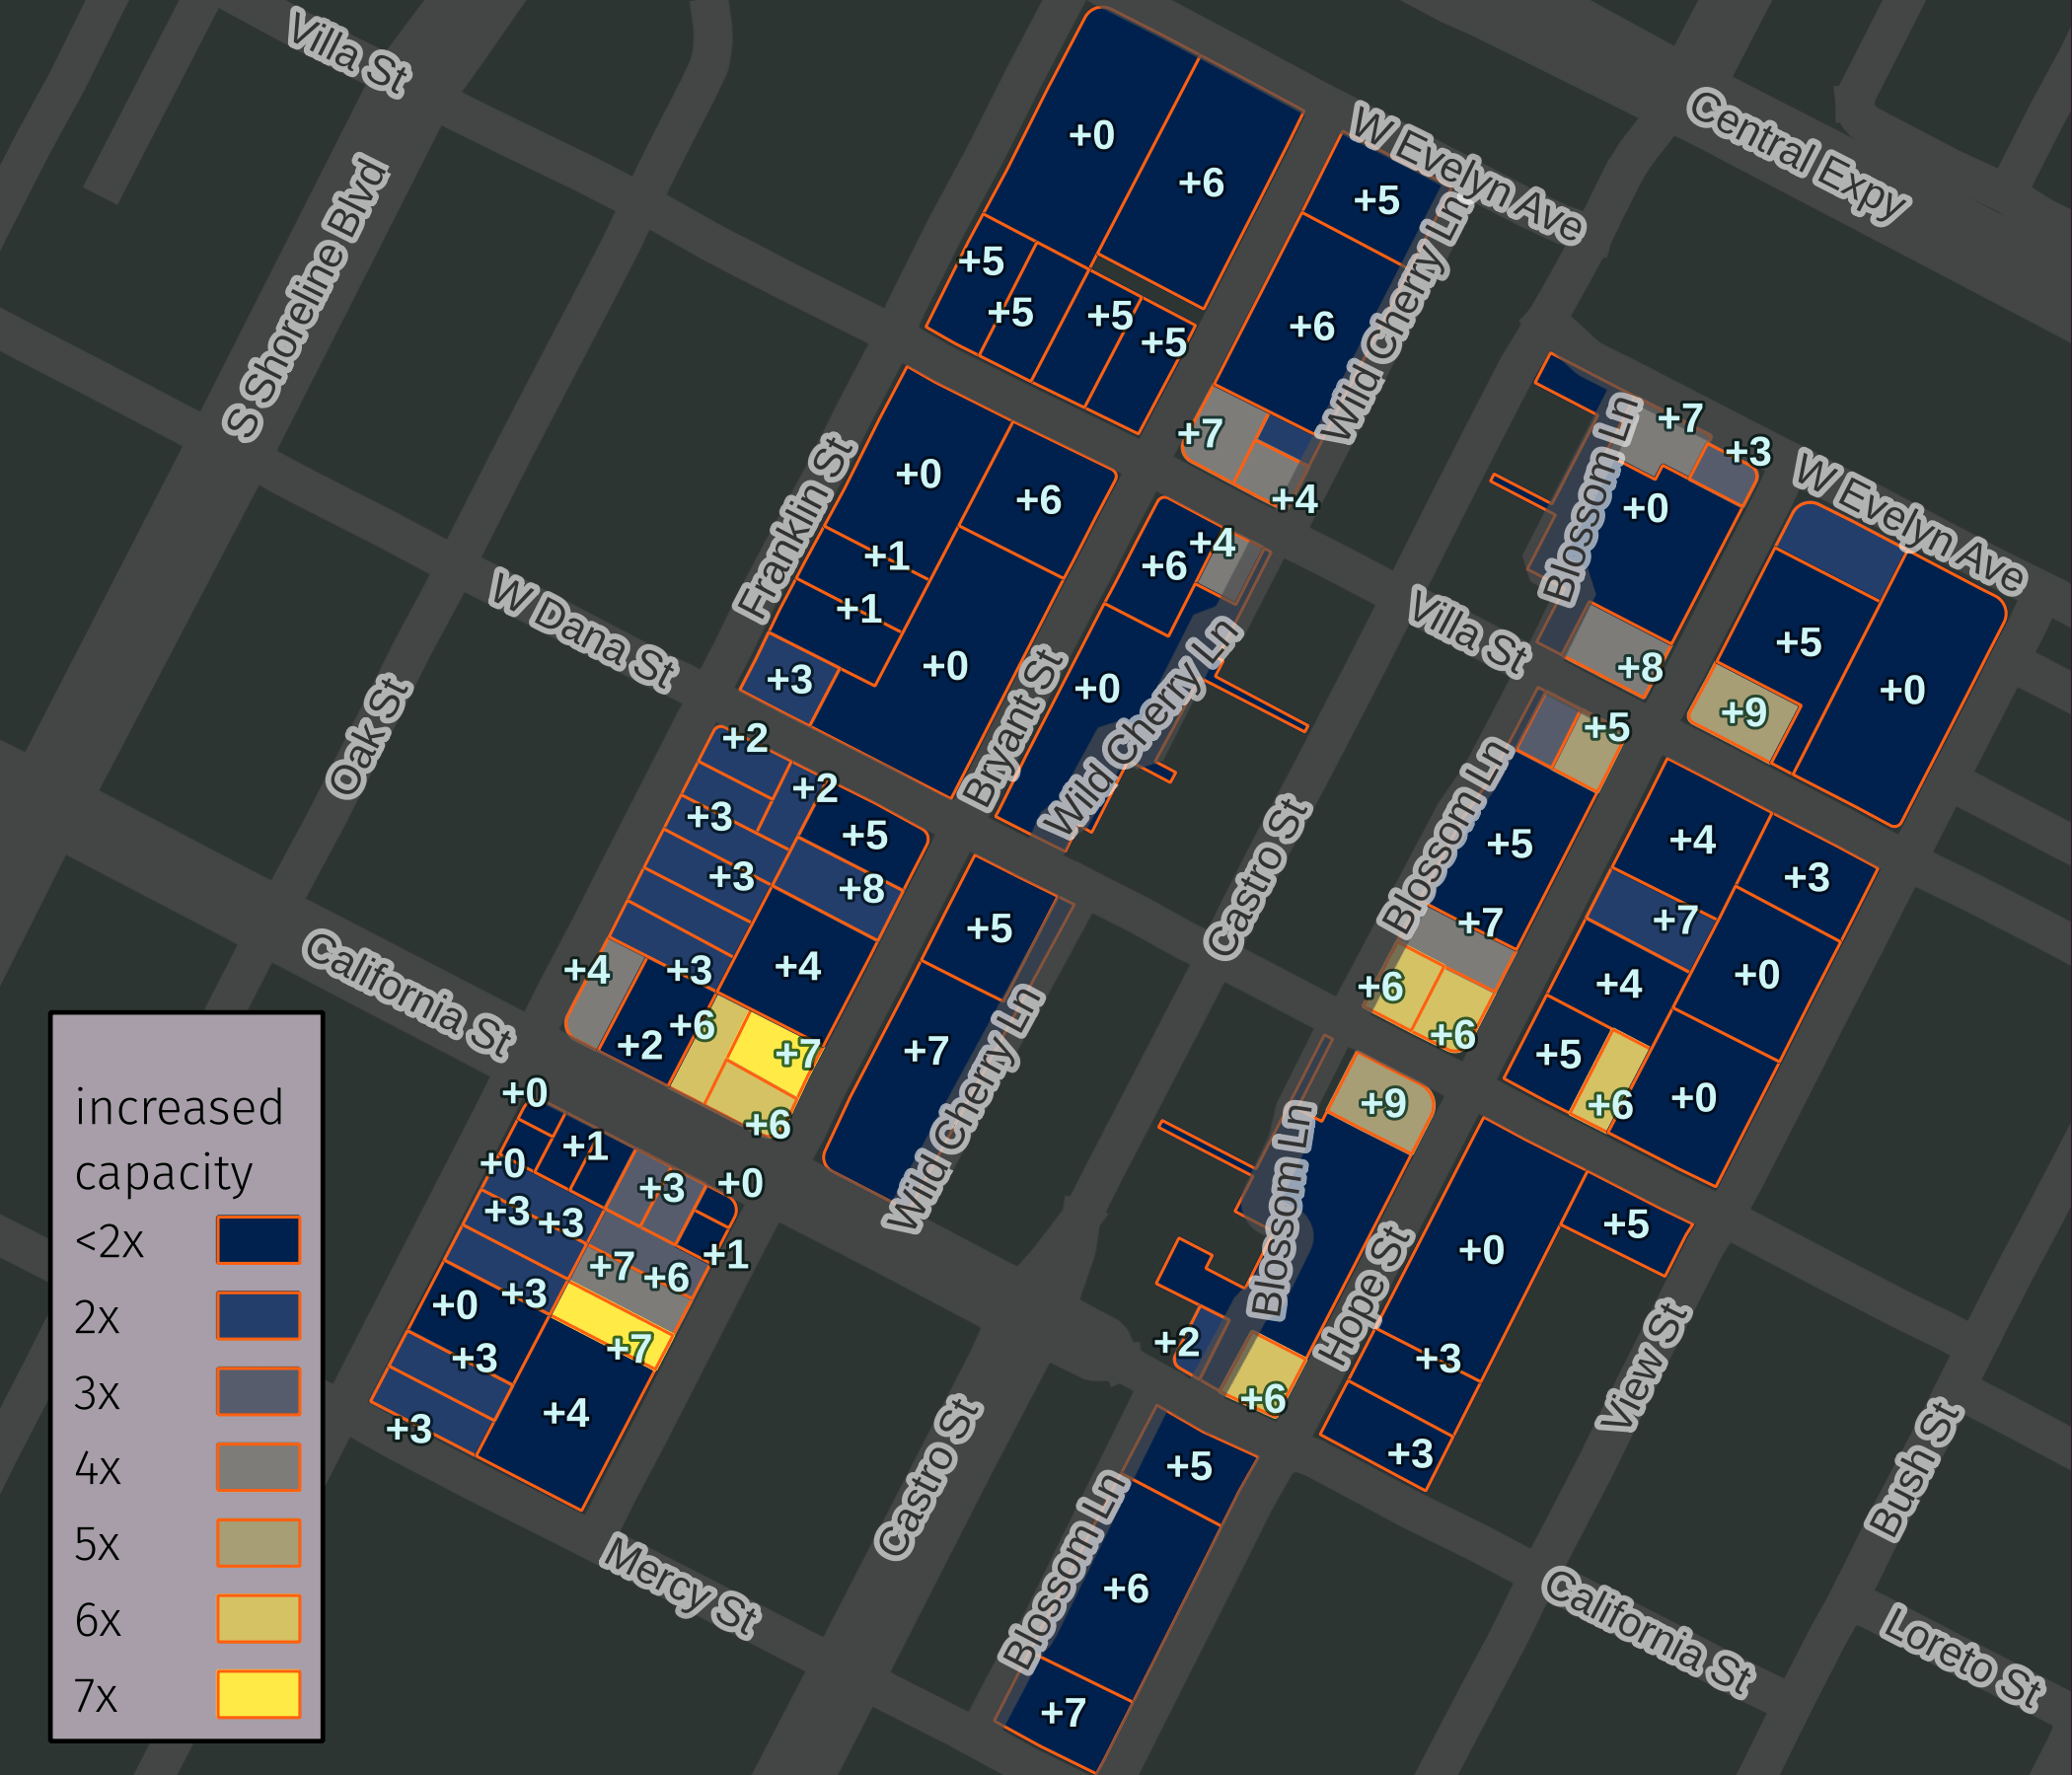
Housing Cost of Sliding Scale in Downtown Mountain View
This is a follow-up to my previous post on housing and zoning around the Mountain View train station.
I got curious how the sliding scale that the downtown plan used for housing affected the number of total units that can be built in the area.
The Downtown Precise Plan uses a sliding scale to allow more housing density on larger parcels than on smaller parcels. The bulk of the plan area is subject to the table below:
| Minimum Lot Area (square feet) | Number of Residential Units | Allowable Density (units/acre) |
|---|---|---|
| Less than 7,500 | 1 | 6 |
| 7,500 | 2 | 12 |
| 10,000 | 4 | 20 |
| 11,250 | 8 | 32 |
| 15,000 | 13 | 38 |
| 22,500 | 22 | 43 |
| 45,000 | 50 | 50 (max. density) |
Many of the lots in downtown are small. I was curious how much more housing would be allowed if we got rid of the sliding scale and just allowed the max density for all parcels.
I analyzed downtown nearest the transit center. I left out the parcels facing Castro St, since special rules apply to development on those parcels. The area analyzed 88 parcels with a combined total area of just over 30 acres.

The results for these parcels are as follows:
| Square Feet | Number of Parcels | Existing Allowed Units | Without Sliding Scale |
| Less than 7,500 | 28 | 28 | 122 |
| 7,500 - 10,000 | 17 | 34 | 121 |
| 10,000 - 11,250 | 4 | 19 | 46 |
| 11,250 - 15,000 | 14 | 113 | 171 |
| 15,000 - 22,500 | 6 | 84 | 107 |
| 22,500 - 45,000 | 13 | 397 | 444 |
| 45,000 or more | 6 | 335 | 335 |
In the area analyzed the plan currently allows for a max of 1,020 homes. Removing the sliding scale would allow for a max of 1,346, an increase of over 30%.